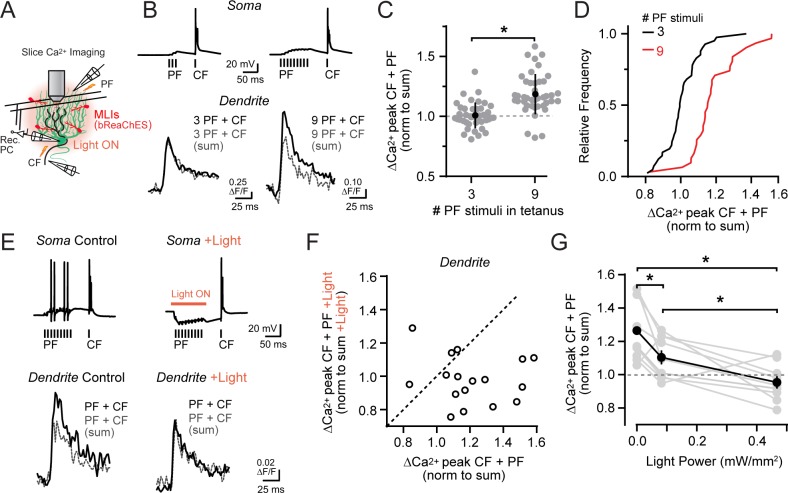
Figure 6. Activity-dependent recovery of supralinear climbing fiber Ca2+ signaling is sensitive to MLI inhibition.
(A) Acute slice recording configuration. In a subset of experiments, bReaChES was expressed in MLIs by Cre-dependent AAV in Kit::Cre mice. (B) Comparison of average climbing fiber-evoked Ca2+ signals in two different PCs with the conjunctive parallel fiber tetanus including either 3 or 9 stimuli (100 Hz). The summed response of the parallel fiber and climbing fiber transients, evoked in isolation on separate trials, is shown in gray. (C) Across-cell comparison shows that increasing the number of stimuli in the parallel fiber tetanus results in a supralinear enhancement of climbing fiber Ca2+ signals in PC spiny dendrites. Individual dendritic recording sites are indicated in gray (N = 41 and 42 dendritic sites from 6 and 4 cells; 3 and 9 stimuli, respectively) with mean data in black (±SEM; p<0.0001; Student’s t-test). (D) In the cumulative probability histogram, supralinear climbing fiber Ca2+ signaling was observed in a majority of PC dendrites when stimulated with a longer lasting parallel fiber tetanus. (E) Climbing fiber-evoked Ca2+ signals at the same PC dendritic site. In interleaved trials, optogenetic activation of MLIs (λ = 596 nm; 40 ms; 0.93 mW/mm2) occurred during the parallel fiber tetanus. (F) Relationship between the change in amplitude of climbing fiber-evoked Ca2+ signals with conjunctive activity of parallel fibers, in trials either with or without optogenetic activation of MLIs during the parallel fiber tetanus (3 to 7 dendritic sites from 4 cells, 17 sites total). Data are normalized to the estimated, summed response of the parallel fiber and climbing fiber transients for each condition recorded at the same PC dendritic location. Dashed line is unity. (G) The effect of varying optogenetic MLI-mediated inhibition on the ability of parallel fibers to produce supralinear climbing fiber Ca2+ signals in PC dendrites. Mean data (black symbols ± SEM) are from matched comparisons at the same dendritic recording site (4 to 5 sites from 2 cells, 9 dendrites total; p<0.05; Repeated measures 1-way ANOVA with Tukey’s post hoc multiple comparison test). Gray symbols are individual measurements.


