. 2018 Aug 22;7:e38867. doi: 10.7554/eLife.38867

Figure 4. IFN-γ inhibits HIV-1 replication in macrophages.

(A and B) HIV-1NLYU2 replication in macrophages (A) or PBMCs (B) treated with increasing concentrations of IFN-γ. Representative of 3 different donors. (C) Comparison of HIV-1 supernatant reverse transcriptase levels, at five days after infection of macrophages or PBMCs treated with increasing concentrations of IFN-γ from (A and B). Error bars represent standard deviation of data from at least three different donors. (D) Microarray analysis of RNA extracted from macrophages treated with IFN-γ or control. The array signal is plotted in arbitrary units (a.u.). (E) HIV-1NLYU2 replication in a PMA treated monocytic cell line (U937 CD4/R5) transduced with lentiviral vectors (CSIB) expressing the indicated upregulated genes from (D). Representative example of 2 independent experiments.

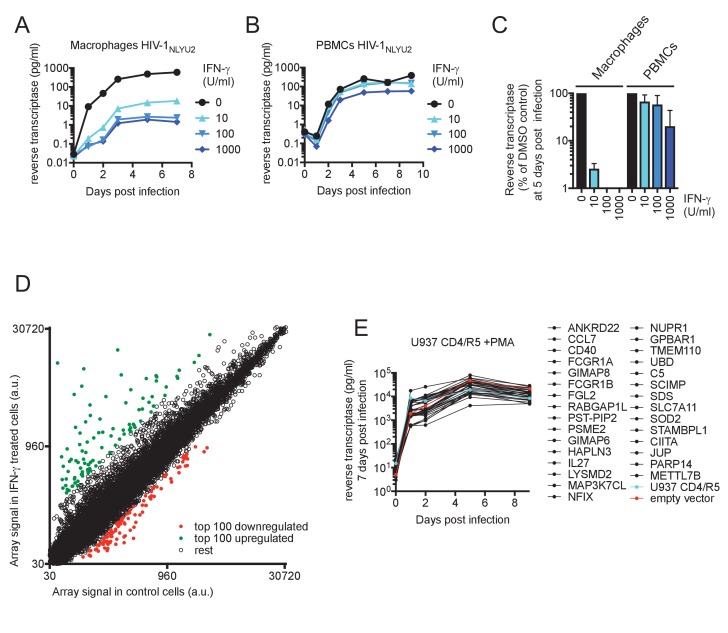
Figure 4.

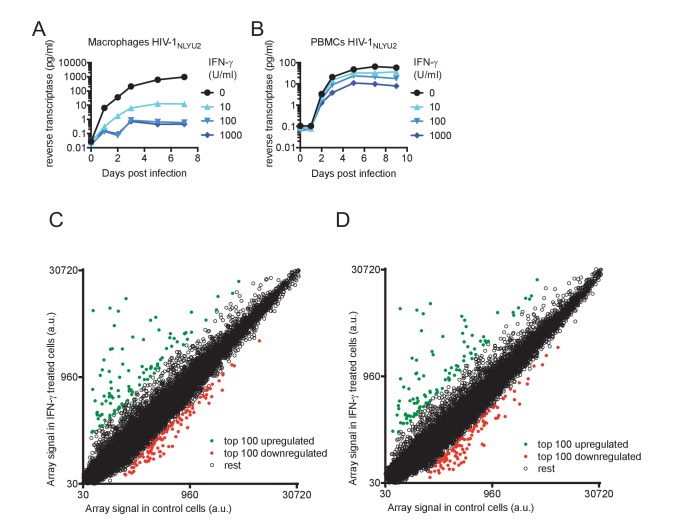
Figure 4—figure supplement 1. Effect of IFN-γ on HIV-1 replication and microarray analysis of IFN-γ-induced changes in mRNA levels.

Figure 4—figure supplement 1.

(A and B) HIV-1NLYU2 replication in macrophages or PBMCs treated with increasing concentrations of IFN-γ. (C and D) Microarray analysis of RNA extracted from macrophages, from two different donors, untreated or treated with IFN-γ. The array signal is plotted in arbitrary units (a.u.).
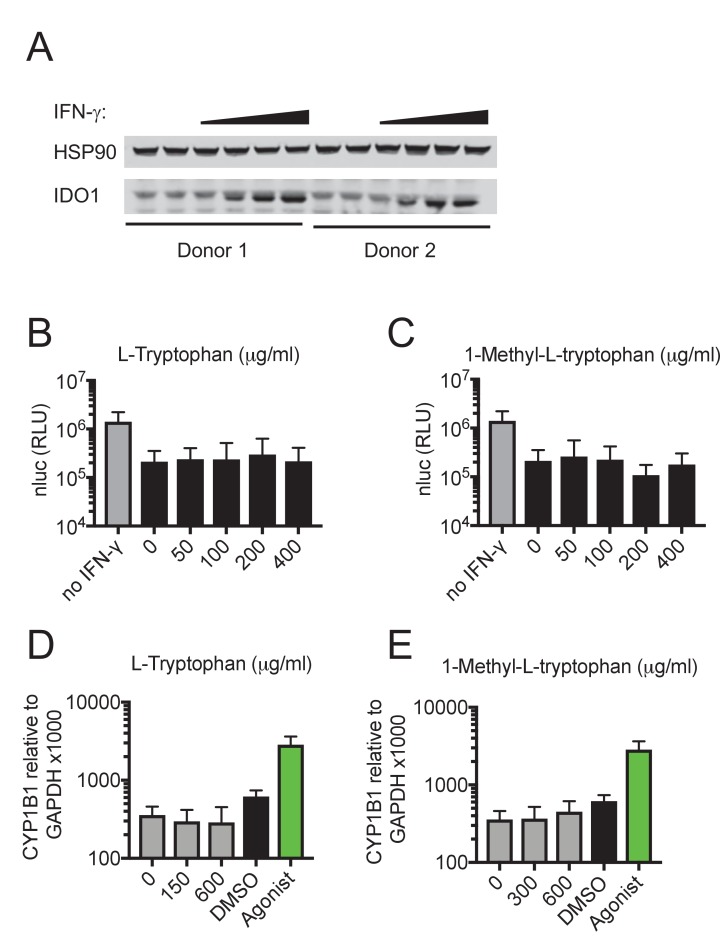
Figure 4—figure supplement 2. IDO1-mediated Tryptophan catabolism does not mediate the IFN-γ induced replication block.

Figure 4—figure supplement 2.

(A) Western blot analysis of HSP90 (loading control) and IDO1 expression in IFN-γ treated macrophages. (B, C) Single round infection in macrophages treated with increasing concentrations of L-Tryptophan (B), 1-Methyl-L-tryptophan (C) respectively, and treated with 10 U/ml IFN-γ before infection with HIV-1NLYU2-nluc. Error bars represent standard deviation of data from two different donors. (D, E) Quantitative PCR analysis of CYP1B1 in aforementioned macrophages treated with L-Tryptophan (D), 1-Methyl-L-tryptophan (E) and 10 U/ml IFN-γ. Error bars represent standard deviation of data from two different donors.