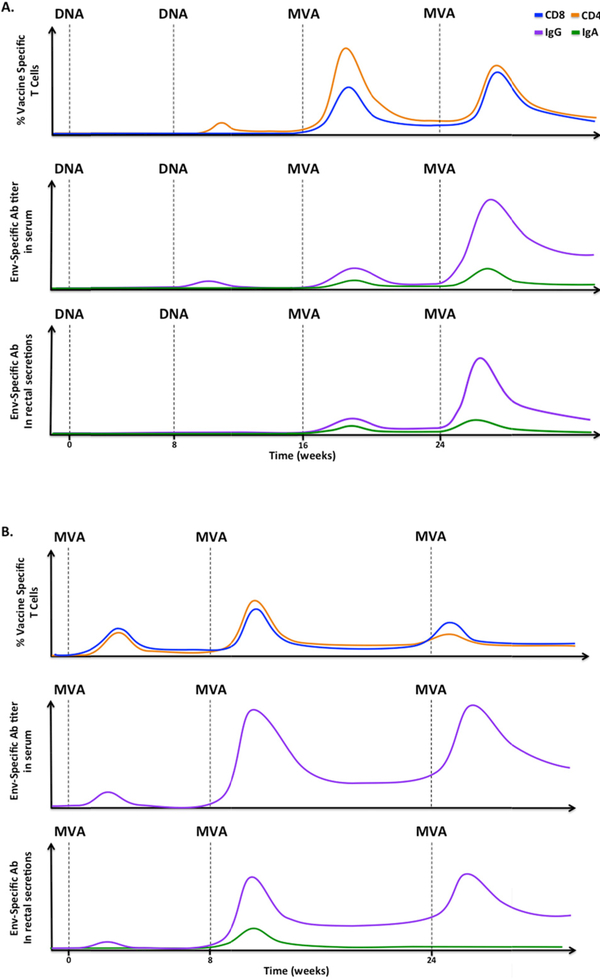
Figure 1. Schematics representing the patterns of vaccine-induced T cells and antibodies after DNA/MVA and MVA only immunizations in rhesus macaques.
Vaccine-induced responses after A) two DNA immunizations followed by two MVA immunizations or B) three MVA immunizations only [81,83]. Top row: SIV-specific CD8+ (blue) and CD4+ (orange) T cell responses. Env-specific serum IgG (purple) and IgA (green) levels in the serum (middle) or mucosae (bottom). Data for Env-specific serum IgA levels are not available for MVA only immunized animals. Please note that these graphs are only models to reveal the patterns and do not depict absolute values.

