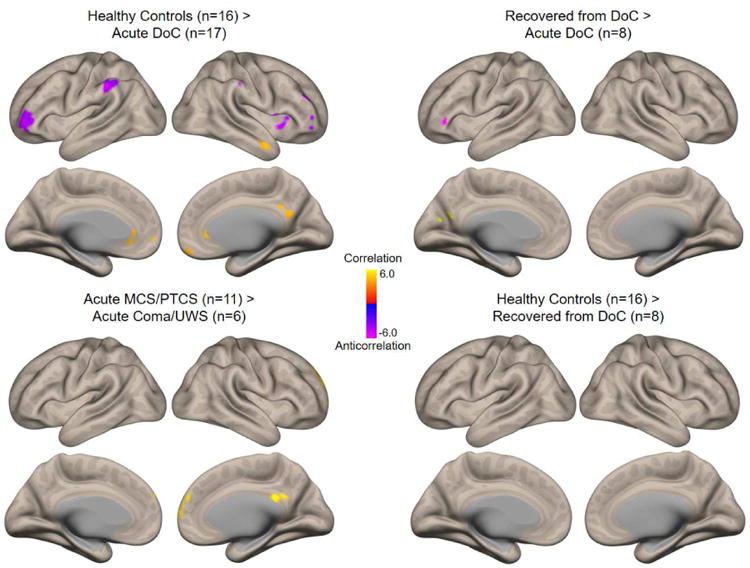
Fig. 2. Differences in default mode network functional connectivity between groups.

Comparisons of resting-state functional connectivity among groups of interest (thresholded height-level P<0.001; cluster-level false discovery rate-corrected P<0.05). Clockwise from upper left: regions with stronger default mode network (DMN) connectivity in healthy subjects than in patients with acute traumatic disorders of consciousness (DoC); regions with stronger connectivity in patients who fully recovered consciousness at 6 months than in the same patients acutely after TBI; connectivity in healthy subjects compared with patients who fully recovered consciousness by 6-month follow-up; and regions with stronger connectivity in patients with acute MCS/PTCS than in patients with acute coma/UWS. Comparisons used the general linear model with motion as a regressor, accounting for paired measures in the longitudinal comparison of recovered versus acute patients.
