
Fig. 4. Global default mode network correlation and anticorrelation.
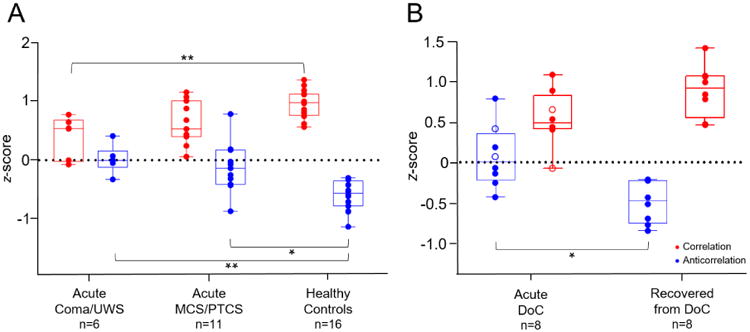
A) Mean global default mode network (DMN) correlation and DMN anticorrelation Fisher's transformed z-scores, by group. Boxes show interquartile range; whiskers extend to minimum and maximum values. Comparisons between coma/UWS, MCS/PTCS, and healthy subjects were conducted with analysis of variance followed by Tukey's test. * = P<0.002; ** = P<0.001. B) Mean global DMN correlation and DMN anticorrelation z-scores in eight patients followed longitudinally. Comparison was conducted with a paired t-test. Open circles represent unconscious patients (coma/UWS), while closed circles represent conscious patients (MCS/PTCS). * = P<0.01.