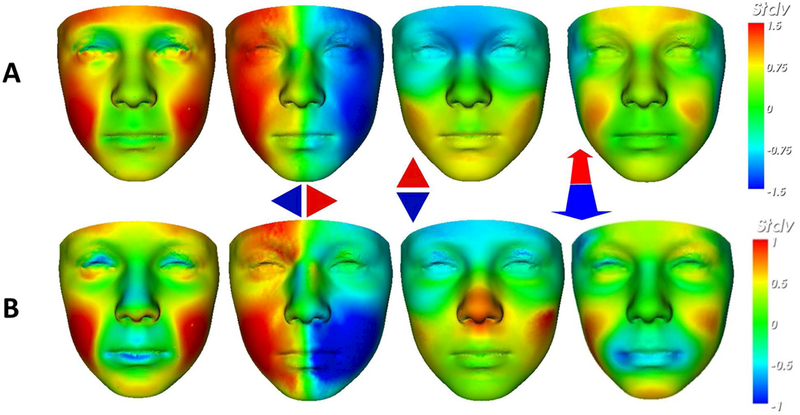
Figure 7.

Comparing mean facial signatures along each axis between A) FAS mean (n=22) at ±1.5SD and B) the FAS-like HE subset (n=17) at ±1SD induced in the caudate nucleus signature graph. This visualisation allows us to identify regions of similar dysmorphism; malar flattening (red in mid-face; cols 1 & 4); philtrum smoothness (faint blue on philtrum groove; col 1); retrognathia (red on the chin; col 4); overall size reduction (red in col 1 and lateral red-blue in col 2). The FAS-like partition on the horizontal axis (B, col 3) also shows shortening of nose (red on columella) which is a FAS-associated feature but is not visible in the equivalent FAS mean signature (A, col 3).
