
Figure 2.
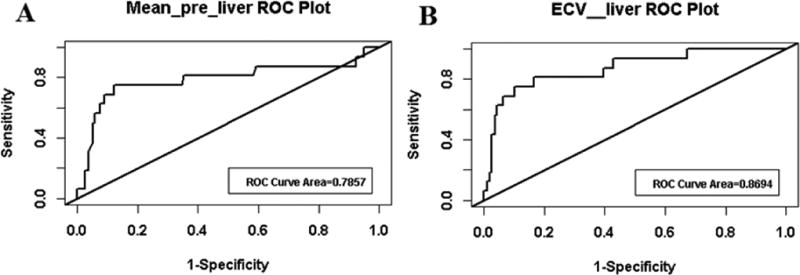
ROC curves generated for mean T1 native liver (A) and liver ECV (B). Graphs created by grouping the Fontan category against the normal cardiac function and TOF category.
Official websites use .gov
A
.gov website belongs to an official
government organization in the United States.
Secure .gov websites use HTTPS
A lock (
) or https:// means you've safely
connected to the .gov website. Share sensitive
information only on official, secure websites.
ROC curves generated for mean T1 native liver (A) and liver ECV (B). Graphs created by grouping the Fontan category against the normal cardiac function and TOF category.