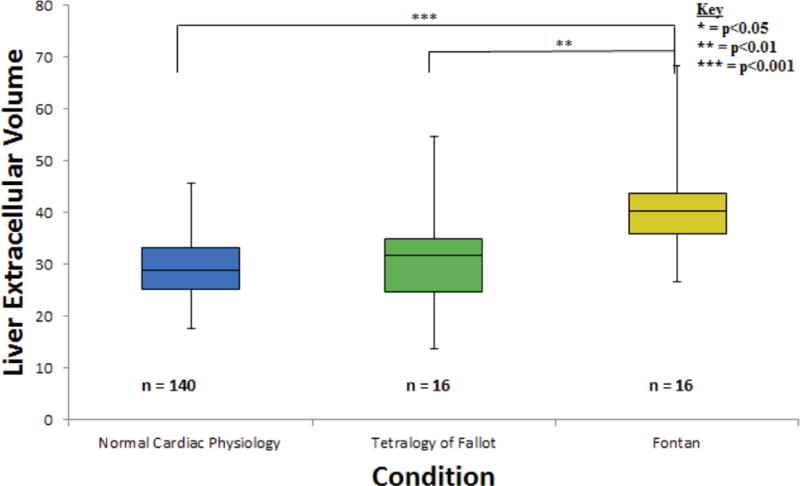
Figure 4.

One liver ECV calculation was performed for each of the 172 total subjects. Data was found to be significantly different (p = 0.0002) between the normal cardiac function and Fontan groups. Additionally, data was found to be significantly different (p = 0.0098) between the TOF and Fontan categories.
