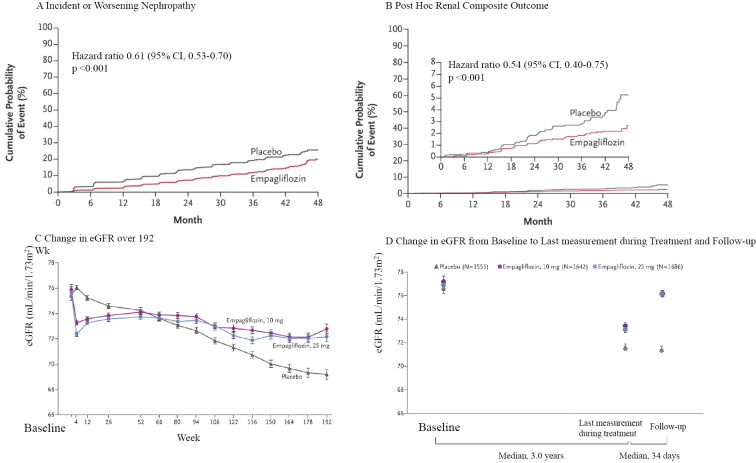
Figure 3.
Renal outcome and renal function over time in the EMPA-REG OUTCOME trial (modified from 5). A: Kaplan-Meier analysis of a prespecified renal composite outcome (incident and worsening nephropathy). B: Kaplan-Meier analysis of a post-hoc renal composite outcome (doubling of serum creatinine level, initiation of renal-replacement therapy, or death from renal disease). The inset shows the data on an expanded y axis. C: Adjusted mean eGFR over a period of 192 weeks. D: Adjusted mean eGFR at the baseline, the last measurement during treatment, and follow-up. The difference at follow-up was smaller in both the 10 mg and 25 mg empagliflozin groups than in the placebo group by 4.7 mL/min/1.73 m2 (p<0.001). eGFR: estimated glomerular filtration rate
Wanner C, Inzucchi SE, Lachin JM, et al. Empagliflozin and progression of kidney disease in type 2 diabetes. N Engl J Med 375: 323-334, 2016.

