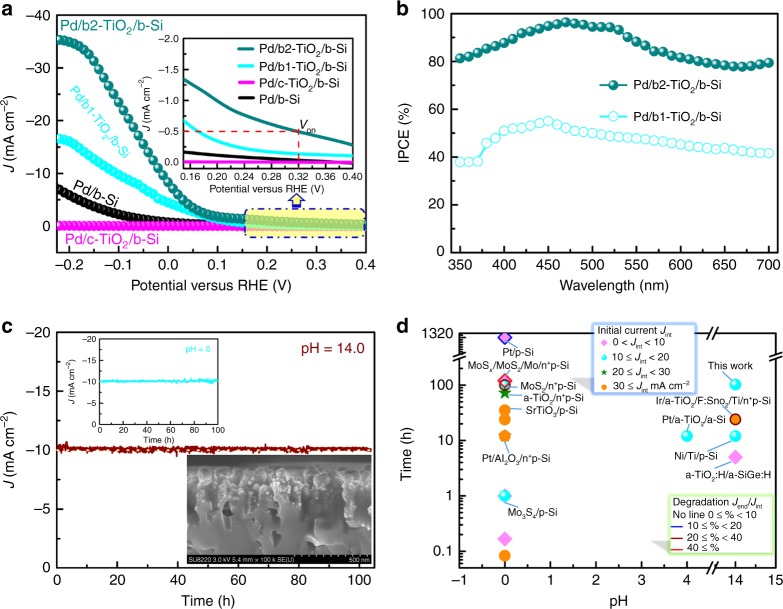
Fig. 5.
PEC performance of Pd/b-Si, Pd/c-TiO2/b-Si, Pd/b1-TiO2/b-Si and Pd/b2-TiO2/b-Si. a Current density (J)-potential (V) curves of all the samples (scan rate is 0.01 V s−1) in 1.0 M NaOH under 1 sun illumination. The current density measured in dark is almost horizontal line, namely 0 mA cm−2. The inset is the high magnification image corresponding to the marked area. b IPCE of Pd/b1-TiO2/b-Si and Pd/b2-TiO2/b-Si in 1.0 M NaOH at −0.22 V vs RHE. c J-time (t) plot of Pd/b2-TiO2/b-Si held at −0.012 V vs RHE in 1.0 M NaOH under 1 sun illumination. The upper-left inset is J–t plot of Pd/b2-TiO2/b-Si held at −0.124 V vs RHE in 0.5 M H2SO4 under 1 sun illumination. The bottom-right inset is cross-sectional FESEM image of Pd/b2-TiO2/b-Si after 100 h PEC water splitting in 1.0 M NaOH. d Chart visualizing data on stabilities of photocathodes including previous and current work, versus tested pH condition, with resulting photocurrent and degradation rate indicated. Most of device structures for the photocathode with reported stability longer than one hour are noted. Jint is the initial photocurrent at the start of the stability test. Degradation rates are calculated using the ratio of the measured photocurrent at the end of the stability test (Jend) to Jint

