Fig. 6.
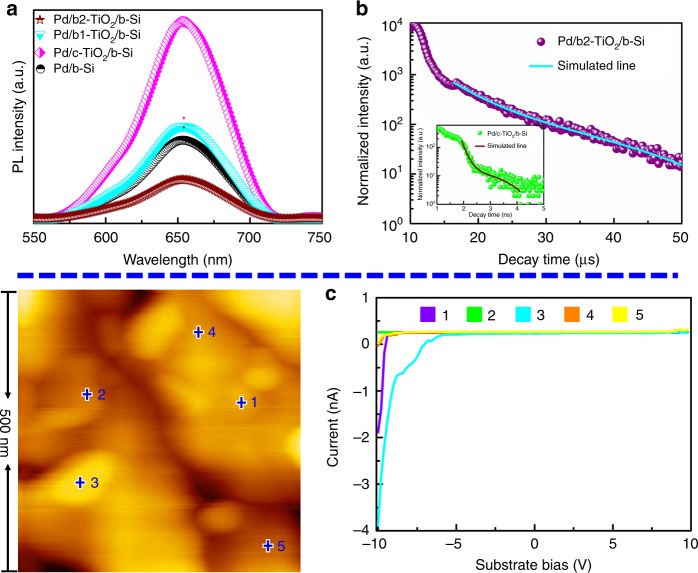
Charge carrier dynamics and paths of the samples. a Room temperature PL spectra of Pd/b-Si (black), Pd/c-TiO2/b-Si (pink), Pd/b1-TiO2/b-Si (Cambridge blue) and Pd/b2-TiO2/b-Si (brown) with excitation wavelength of 405 nm. b Time-resolved PL decay curve for Pd/b2-TiO2/b-Si at room temperature. Solid lines represent the kinetic fit using bi-exponential decay model. The inset is the time-resolved PL decay curve dor Pd/c-TiO2/b-Si. c AFM topography image and typical I–V curves of marked position by the number for Pd/b2-TiO2/b-Si. Position 1, 2, 3, 4, and 5 in AFM image corresponding to purple, green, Cambridge blue, orange and yellow I–V curve, respectively

