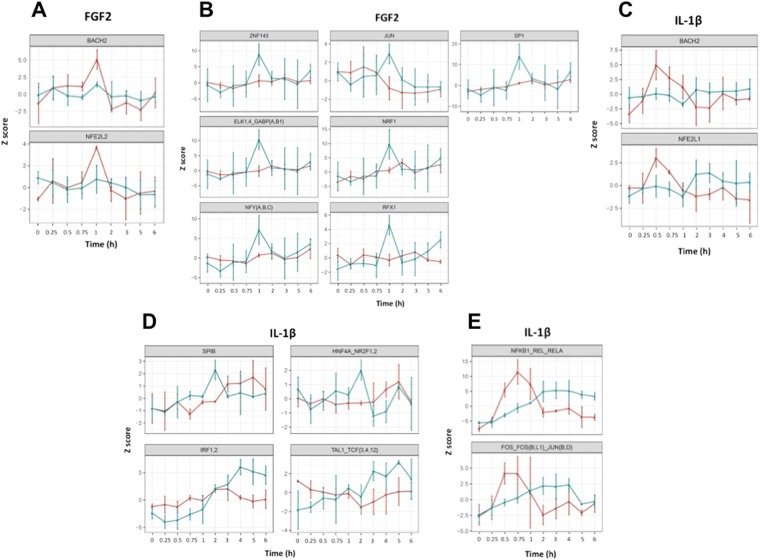
Figure 4.
MARA showing dynamic changes in motif activity in response to FGF2 or IL-1β. (A) Motifs with dynamic activity in enhancers only in response to FGF2. (B) Motifs with dynamic activity in promoters only in response to FGF2. (C) Motifs with dynamic activity in enhancers only in response to IL-1β. (D) Motifs with dynamic activity in promoters only in response to IL-1β. (E) Motifs with activity that peaks in enhancers before promoters in response to IL-1β. Data refer to enhancer (red) and promoter (green).

