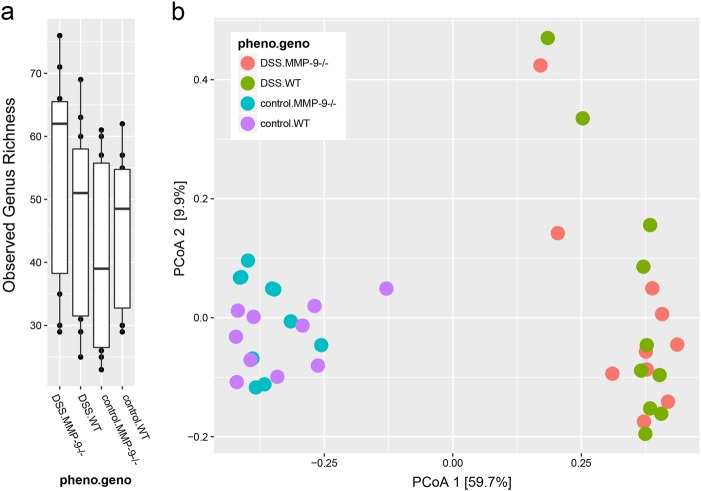
Fig. 2.
Fecal microbiota diversity in control and DSS-treated MMP-9-/- mice and WT littermates. a Box plot representation of microbiota richness (number of observed operational taxonomic units [OTUs] per sample) distribution across MMP-9-/- and WT mice. b Variation in microbial community composition represented by a principal coordinates analysis (PCoA) of the Bray–Curtis dissimilarity matrix, calculated from the OTU-level relative abundance matrix. Pheno.geno indicates the combination of phenotype (control or DSS) and genotype (WT or MMP-9-/-) within each of the four experimental groups

