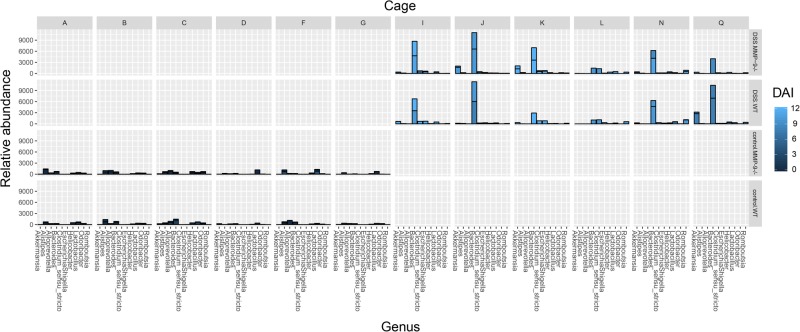
Fig. 6.
Drivers of changes in fecal microbiota composition at the genus level. Bar plot depicting the relative abundance of the 10 most abundant genera in all samples. Samples are divided per cage (A, B, C, D, F, G, I, J, K, L, N, and Q) and the four respective phenotype–genotype combinations (DSS.MMP-9-/-, DSS.WT, control.MMP-9-/-, and control.WT). The color intensities of the bars represent the disease activity index (DAI) with brighter colors indicating higher inflammatory burden. Each bar of the histogram represents the cumulative relative abundance of all samples within one group and the line within each bar indicates the separation of each sample within the group. If no line is observed within the bar, only one sample was available

