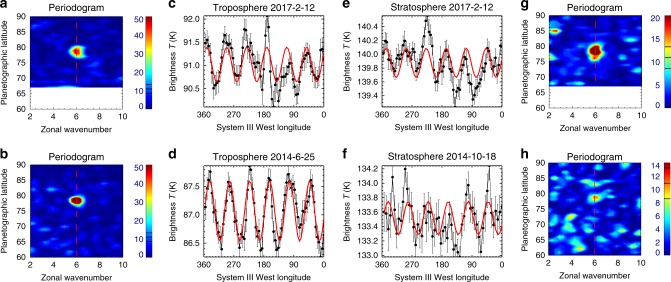
Fig. 2.
Detection of the hexagon in the troposphere and stratosphere. c–f show brightness temperatures and their uncertainties in the troposphere (c, d, averaged over 600–620 cm−1) and stratosphere (e, f, averaged over 1280–1320 cm−1) extracted from 77–79°N in the June 25, 2014 and February 12, 2017 REGMAP observations, and the October 18, 2014 FIRMAP observation. As a guideline, a wavenumber-6 sinusoid has been fitted to each observation (red curve), although the stratospheric map in 2014 is extremely noisy. a, b, g, h show the corresponding Lomb Scargle periodograms5, displayed as a function of latitude, showing the spectral power contained in each longitudinally resolved brightness temperature scan. Black lines on the colour bars represent false-alarm probabilities (from top to bottom) of 0.001, 0.01 and 0.1. A wavenumber-6 feature is clear in each data set near 78°N (vertical red dashed line), although the 2014 stratospheric hexagon is rather noisy (Fig. 1b). Using the sinusoidal fits, we detect a westward shift in the tropospheric hexagon vertices of 8.5 ± 1.1° over 963 days (the uncertainty comes from the quality of the sinusoidal fit). Offsets between the tropospheric and stratospheric vertices were <4° in February 2017

