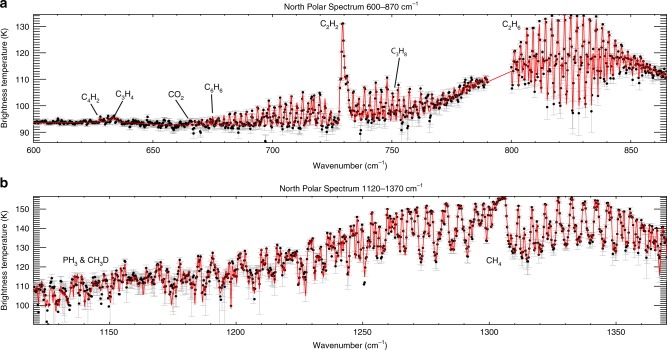
Fig. 5.
Best-fitting brightness temperature spectrum for the 0.5-cm−1 resolution observation of the NPSV on March 27, 2017 (spanning 84–87°N). The figure shows the model fit (red) to the data (black points with grey uncertainties). The figure is split into the two spectral ranges used in the inversions: a 600–870 cm−1 and b 1120–1370 cm−1. Key gaseous features are labelled. Data between 870 and 1120 cm−1 were omitted from the inversion. The measurement uncertainties (grey bars) depend on the number of coadded CIRS spectra and the number of deep space reference spectra used in the calibration

