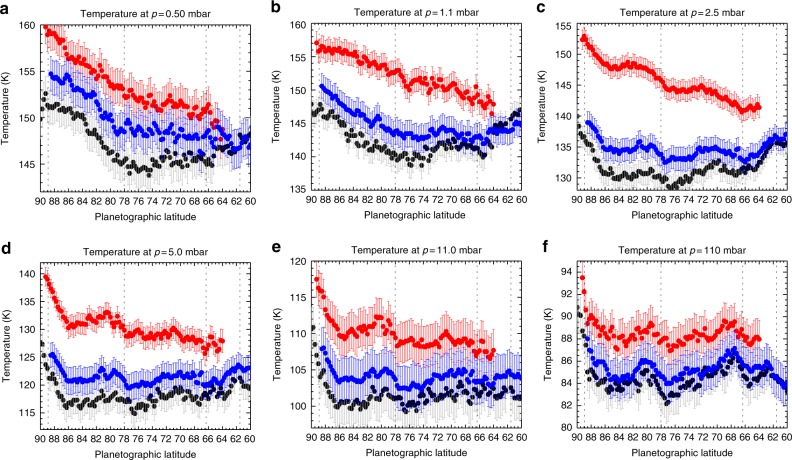
Fig. 8.
Zonal-mean north polar temperatures for three REGMAP data sets showing the warming of the polar stratosphere. Temperatures are displayed at six pressure levels: a 0.5 mbar, b 1.1 mbar, c 2.5 mbar, d 5.0 mbar, e 11 mbar, and f 110 mbar. Three dates are included in each panel: August 17 2013 (black, REGMAP 196–001), June 25 2014 (blue, REGMAP 205–001), and February 12 2017 (red, REGMAP 261–003). Vertical dotted lines show the locations of prograde jet peaks9 for comparison with the meridional temperature gradients. Error bars represent the formal retrieval uncertainty. Note that the June 2014 data set utilised 15-cm−1 resolution spectra, whereas the 2013 and 2017 data sets are better constrained by 2.5-cm−1 resolution spectra

