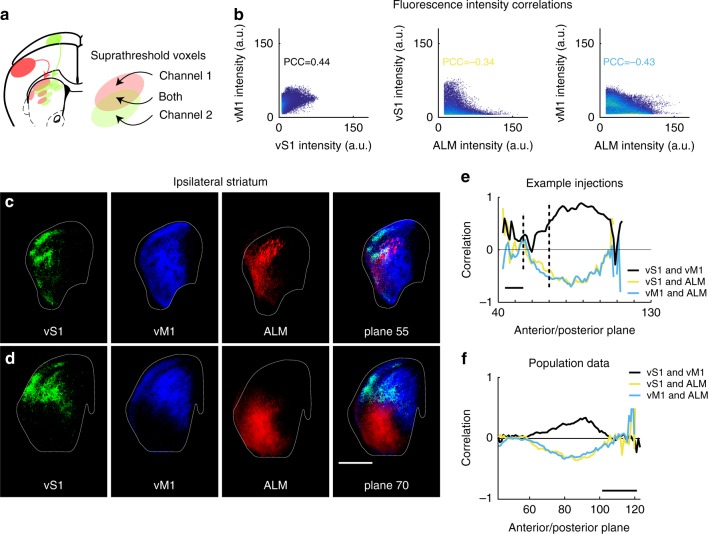
Fig. 2.
Computation of correlation for projections to ipsilateral striatum. a Correlation for two projections (red and green channels) in a given structure (striatum, illustrated) is computed based on voxels where both channels are suprathreshold. b For three example Tlx3_PL56 (IT-type) mouse injections in vM1, vS1, and ALM, scatterplot of all voxel intensities (8-bit imaging; arbitrary units) in ipsilateral striatum for two injections. Blank space between axis and points indicates threshold. Individual points in dark blue; multiple points increase yellow intensity. c, d Example coronal images from aligned brains in corresponding planes showing arborization of IT-type axons in ipsilateral striatum. vS1 shown in green, vM1 in blue, and ALM in red. Scale, 1 mm. e Correlation coefficient as a function of anterior/posterior plane in ipsilateral striatum for pairwise comparisons between three example injections. Correlation is noisy at anterior and posterior poles of striatum due to small voxel numbers in those planes. Scale, 1 mm. f Population mean correlation coefficient as a function of anterior/posterior plane in ipsilateral striatum for pairwise comparisons (the mean correlation for each vS1 compared to each vM1 in black, for example). vS1 and vM1 comparison, N = 340 injection pairs; vS1 and ALM comparison, N = 204; vM1 and ALM comparison, N = 240. Scale, 1 mm

