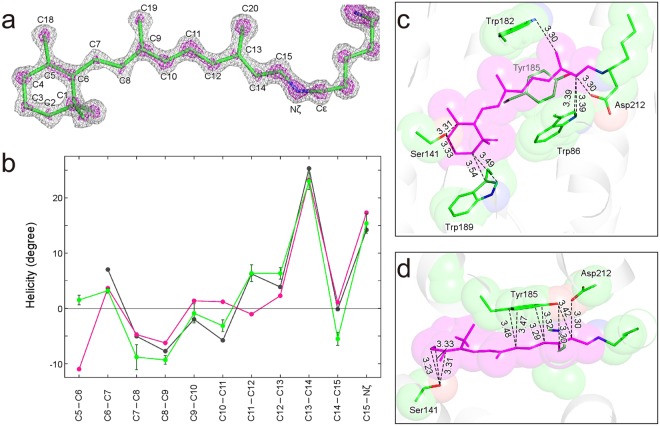
Figure 3.
Detailed information for the retinal chromophore. (a) The Fobs − Fcalc omit map of retinal and the side chain atoms of Lys216 is shown at contour levels of 4σ (gray) and 7σ (magenta). (b) Plot for the helicity angle along the polyene chain of retinal. The helicity for this study is plotted in green. Bars represent standard deviations derived from the three structures. In addition, helicities for 1C3W10 and a DFT/MM optimized structure26 are plotted magenta and gray, respectively. The helicity η, a twist from the planar conformation, is calculated with the relation, η(°) = (180 − torsion) × (−1)n (ref.26). (c) Interactions between retinal and the protein environment. Side chains of residues within 3.5 Å from retinal are shown as semi-transparent spheres. (d) The top view of (c).

