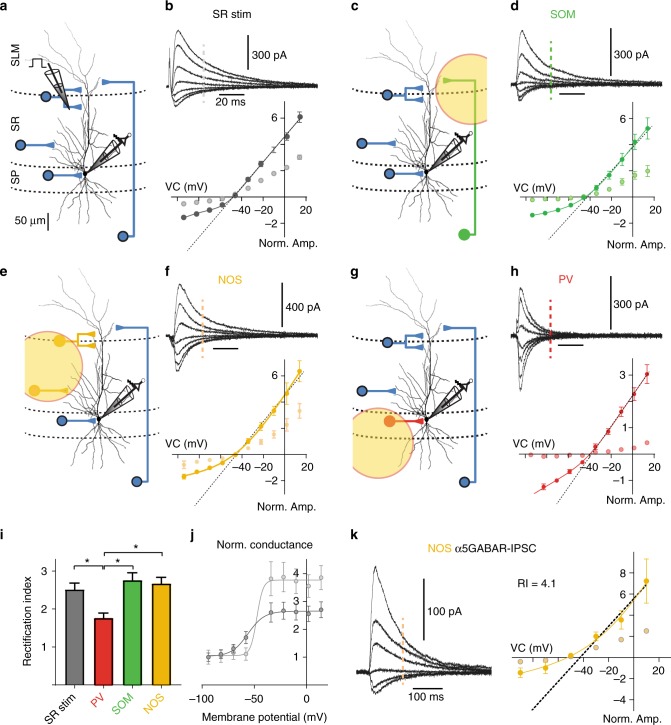
Fig. 4.
Dendritic synaptic inhibition by SOM and NOS interneurons is strongly outward rectifying. a Experimental design for local stimulation of GABAergic inputs in the outer third of SR. b IPSCs evoked at the border between SLM and SR were recorded at different membrane potentials in the presence of 10 µM NBQX and 25 µM AP5 using a Cs-gluconate-based solution. Bottom, group data (n = 11) show the mean IPSC amplitudes depending on the holding potential. Dark gray depicts the peak values, light gray the amplitude of the tail current measured at 30 ms after stimulation (indicated by dashed line in the top panel). The solid line represents a nonlinear fit according to equation 1 (Methods), while the dashed line represents a linear fit to values above –40 mV. c–h The same for optogenetically activated inputs from specific interneuron populations. Field of illumination relative to the recorded cell is indicated. i Mean rectification indices (RI) were quantified as the ratio of the conductance extrapolated from the linear fit to the outward currents above –40 mV divided by the measured value at –82 mV (1 = no deviation). The mean RI in PV-ChR2 stimulations (n = 8) was significantly smaller than in all experiments with dendritic inputs (SR: P < 0.01; paired t test, n = 11; NOS: P < 0.001, n = 9; SOM: P < 0.001, n = 9). j The voltage dependence of the peak (dark gray) and tail conductance (light gray) for electrically stimulated dendritic inputs. Conductances were normalized to –82 mV. k The grand mean of α5-GABAR-mediated IPSCs from NOS-ChR-stimulated IPSCs (n = 10) isolated by application of L-655,708 (50 nM). Mean IPSC amplitude is plotted against holding potential. Tail currents measured at 120 ms after stimulation are indicated (lighter shaded dots). The RI was calculated as the ratio of the conductance extrapolated from the linear fit to the outward currents above –40 mV (dashed line) divided by the conductance at –82 mV interpolated by the nonlinear fit to the measured PSCs (solid line). Recording temperature T ≈ 33 °C for a to j, and T ≈ 22 °C for k

