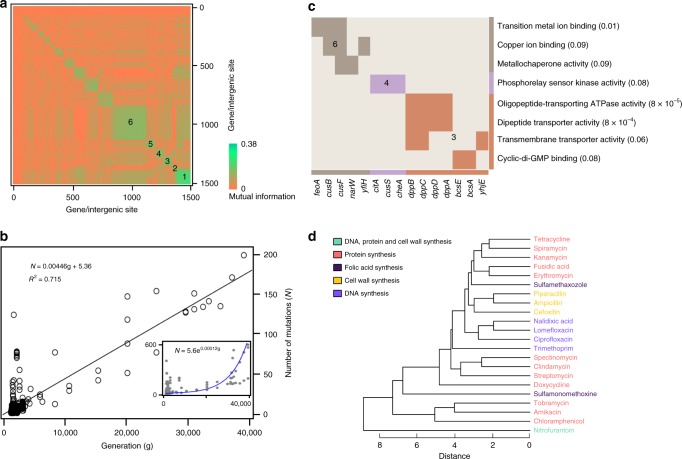
Fig. 3.
Mutation profile analysis for co-occurrence and functional relationships. a Spectral clustering of mutations occurring in two or more conditions. Squares along the diagonal represent clusters of genome sites which are highly correlated with respect to mutation profiles. The average pairwise mutual information in each cluster decreases from cluster 1 to cluster 6. Heatmap based on mutual information. b The enriched molecular function GO terms and corresponding genes. In each cluster the genes mapped to the same GO terms are together (clusters have different colors and indices). The numbers following each GO term are p values calculated by DAVID (p value threshold is 0.1). The color bar at the bottom and right indicates the membership of the GO terms/genes among the three clusters. Only clusters with enriched GO terms are shown. c The number of mutations as a function of generations elapsed, with hypermutator strains excluded. Inset shows patterns when hypermutators are included with fitted exponential curve in the inner plot being N = 5.6e0.00012g. The R2 for linear and exponential fitting is 0.72 and 0.35, respectively. d A dendrogram illustrating the clusters of antibiotics generated by hierarchical clustering. The legend describes the action mechanism of each category of antibiotics. When computing the pairwise distance, the Euclidean distance between mutation profiles was used

