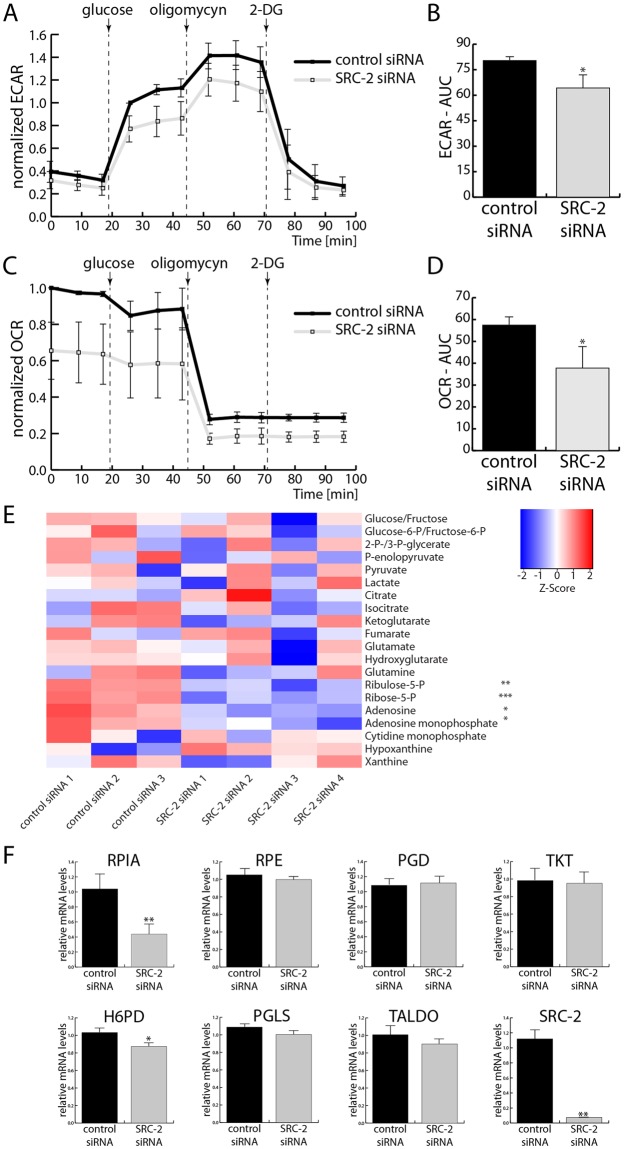
Figure 2.
Upkeeping of glycolysis, OXPHOS, and the PPP in EC cell necessitates SRC-2. (A) Extracellular acidification rate (ECAR), measured before and after the addition of glucose and after the additions of oligomycin and 2-deoxyglucose (2-DG); quantification of the areas under the curves (AUC) are presented in (B). (C) Measurement of oxygen consumption rate (OCR) under the same conditions as described in (A) with AUC quantified in (D). (E) Quantification of steady metabolite levels in Ishikawa cells after control and SRC-2 knockdown. Each column represents a biological replicate of cells after either control or SRC-2 siRNA transfection (numbers 1–4 indicate biological replicates). Each row represents quantification of a metabolite which has been normalized with R heatmap.2() function’s default z-score row scaling. (F) Levels of mRNAs encoding enzymes of the PPP measured by RT-qPCR.

