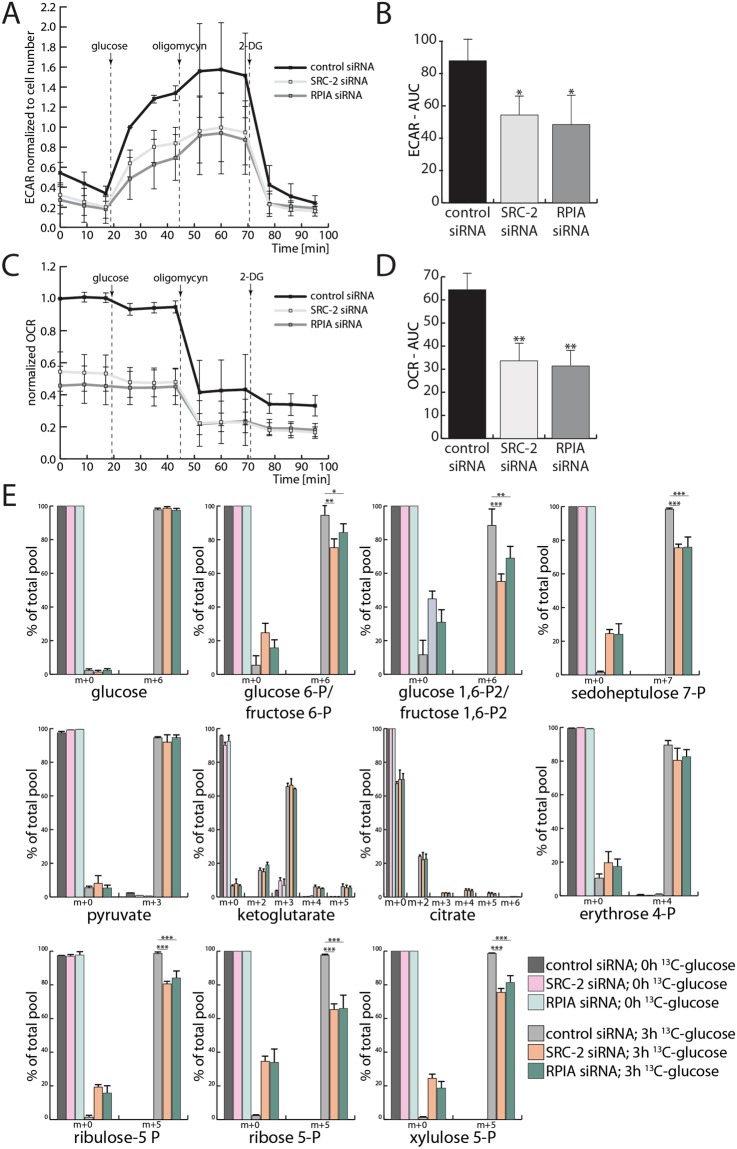
Figure 4.
RPIA maintains glycolytic capacity, oxidative phosphorylation, and the PPP. (A) Extracellular acidification rate (ECAR) with quantification of the areas under the curves (AUC) presented in (B) of cells transfected with control, SRC-2, or RPIA siRNA. (C) Measurement of the oxygen consumption rate (OCR) under the same conditions as described in (A) with AUC quantified in (D). (E) Proportion of 12C- and 13C-containing metabolites of glycolysis, the TCA cycle, and the PPP isolated from Ishikawa cells before and after a 3 h treatment with 13C(6)-glucose. The x axis labels indicate the metabolites containing only 12C (m + 0) or also 13C (m + 1, +2, +3, +4, +5, +6, and +7) isotopes.

