Fig. 1.
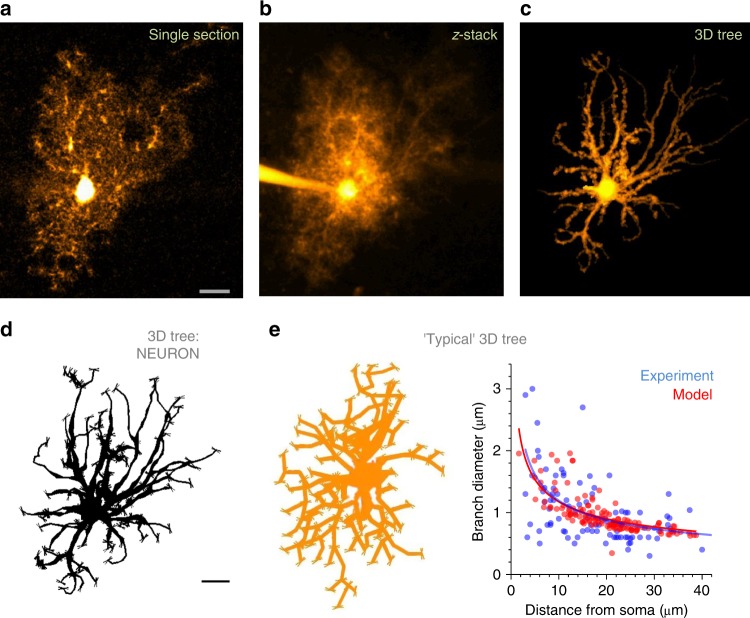
Reconstructing astroglial stem tree in silico. a A characteristic image of CA1 astroglia, whole-cell load with Alexa Fluor 594 (λx2p = 800 nm), single optical section (stratum radiatum, depth of ~100 µm). Scale bar, 10 µm (applies to a–c). b Cell as in panel a shown as a full z-stack projection. c Stem tree of astroglia shown in a and b, separated and reconstructed in 3D using NeuroTrace (Fiji ImageJ, NIH); 2D view of a 3D image. d Astrocyte stem tree shown in panel c quantified, loaded and displayed in NEURON format using Vaa3D (Allen Institute); thin ‘buds’ indicate initial seeds for ‘planting’ nanoscopic protrusions at a certain longitudinal density; 2D view. Scale bar, 10 µm (applies to d and e). e Diagram, ‘typical’ astrocyte stem tree built by modifying a library neurogliaform cell (2D view); plot, matching the branch diameters in the model (red) and in recorded astroglia (blue; n = 13 cells including 98 dendrites); solid lines, the best-fit dependence (power low, y = a ∙ xb) for the corresponding data scatters

