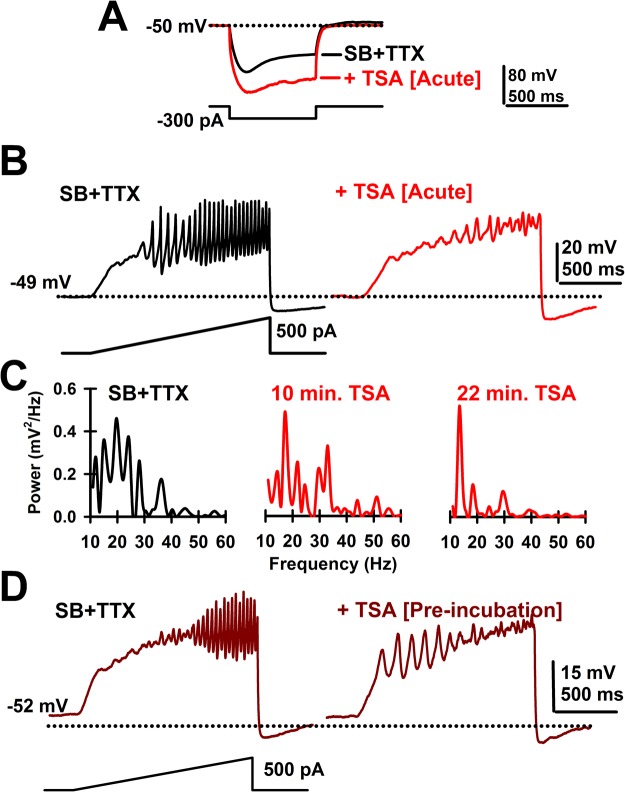
Figure 1.
Effects of acute TSA. (A) Voltage records in response to hyperpolarizing steps after SB + TTX (black record) and following TSA (20 min; 1 μM, red record) showing the increase in resistance induced by acute TSA exposure. (B) Ramp-induced oscillations after SB + TTX (black record) as previously reported for PPN neurons and effects of acute TSA exposure (20 min; 1 μM, red record) showing elimination of fast oscillations and decreased amplitude of oscillations. (C) Representative plots of power spectrum over time for acute TSA (1 μM) bath application. (D) Ramp-induced oscillations in a representative PPN cell showing low amplitude, low frequency oscillations in the presence of SB + TTX after prolonged exposure to TSA (120 min; left side record).

