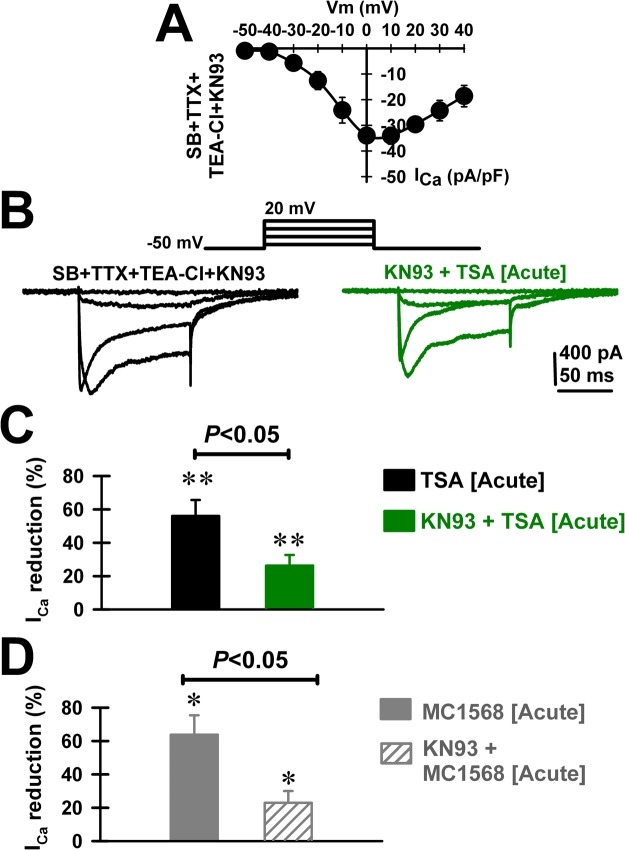
Figure 5.
Effects of pre-incubation with the Ca2+-calmodulin‐dependent kinase type II (CaMKII) inhibitor KN-93 (1 μM) on the TSA- (1 μM) and MC1568- (1 μM) induced reduction of ICa. (A) Standard current-voltage (I-V) relationship of ICa after 30 min incubation with KN-93 (n = 5 PPN neurons). (B) Representative ICa recorded using 100 msec long depolarizing square steps from a holding potential of −50 mV to 0 mV after 30 min incubation with KN-93 (1 μM; black record) and after acute bath application TSA (20 min, 1 μM; green record). (B) Percent reduction in ICa amplitude in a group of PPN cells (n = 8) recorded after acute bath application TSA (20 min, 1 μM; black bar), and following pre-incubation with KN-93 (1 μM; n = 7; green bar). **p < 0.01 significant reduction of ICa by acute bath application of TSA (Paired Student’s t-test; t = −3.77; df = 7; p = 0.007), or KN93 + TSA (paired Student’s t-test; t = −3.96; df = 6; p = 0.007). Note the statistically significant KN-93-dependent blunting effect of the TSA-induced reduction of ICa (One-way ANOVA; F(1,13) = 6.3; p < 0.05; post-hoc Bonferroni’s t-test, t = 2.51, p = 0.03). (C) Percent reduction in ICa amplitude in a group of PPN cells (n = 6) recorded after acute bath application MC1568 (20 min, 1 μM; solid grey bar), and following pre-incubation with KN-93 (1 μM; n = 6; dashed grey bar). *p < 0.05 significant reduction of ICa by acute bath application of MC1568 (n = 6 PPN cells; paired Student’s t-test, t = 3.46; df = 5, p = 0.018), or KN93 + MC1568 (n = 6 PPN cells; paired Student’s t-test, t = −3.75; df = 5, p = 0.013). Note the statistically significant blunting effect of KN-93 on the mean ICa reduction by MC1568 (One-way ANOVA; F(1, 10) = 9.24; p = 0.013; post-hoc Bonferroni t-test; t = 3.04; p < 0.05).

