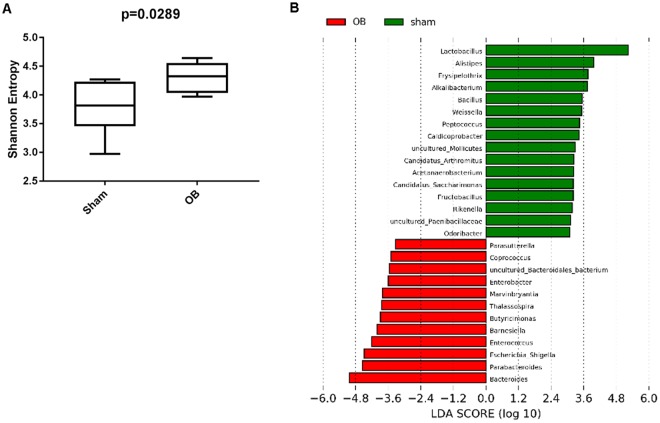
Figure 3.
Alpha diversity and LEfSe analysis of fecal contents from sham and obstruction rats at genera level. Alpha diversity at genera level is represented in terms of Shannon diversity index and statistical significance was calculated using Mann-Whitney test and p < 0.05 is considered significant (A). LEfSe analysis for effect size measurement of differentially abundant genera in OB compared to sham rats is depicted in (B). Genera enriched in sham are represented in positive LDA score (green) and genera enriched in obstruction condition are represented in negative LDA score (red).

