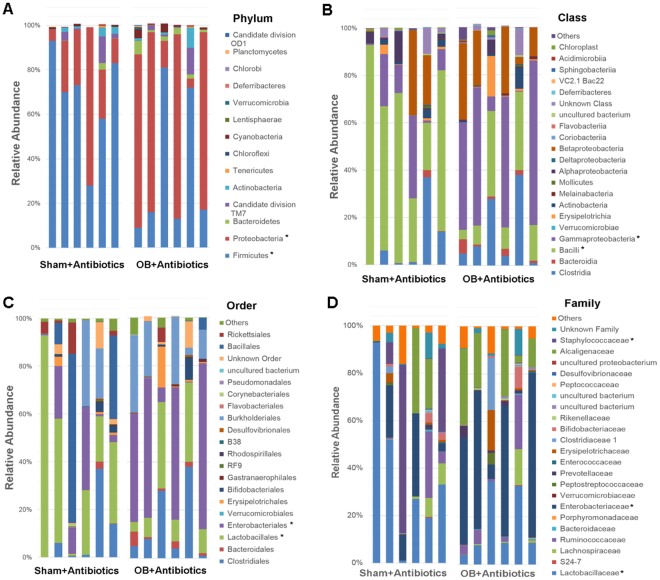
Figure 5.
Comparison of Colon microbiota composition in sham and OB rats after antibiotic treatment. Total DNA was extracted from colon feces collected from sham and OB rats after antibiotic treatment (Sham + AB and OB + AB) and 16S rRNA high throughput sequencing was carried out. The graphs show the colon microbiota composition at Phylum level (A), Class level (B), Order level (C) and Family level (D). (sham + AB, n = 6; OB + AB, n = 6). *Indicates the taxa with significantly different abundance between the two groups (2-way ANOVA, p < 0.05).

