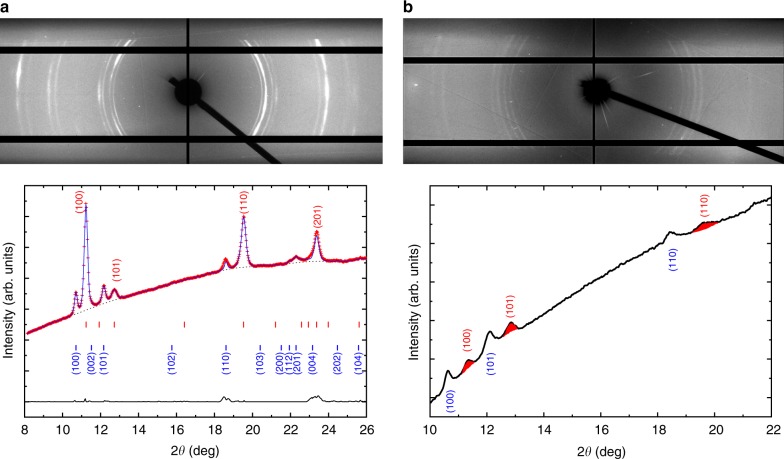
Fig. 3.
X-ray diffraction patterns above 5 megabar. The top images (both a, b) are the 2D diffraction patterns showing doubling of the diffraction patterns originating from the low pressure off culet (toroidal well) and high pressure on culet areas. On the bottom panel the integrated diffraction patterns are shown. a First pair of V3 diamonds, X-ray wavelength for this pattern λ = 0.405473 Å, the dotted line represents the background subtracted before Rietveld refinement, blue line is the refined pattern, and the black continuous line is the residual to the experimental data (red+). Red ticks represent the high-pressure Re diffraction peak locations and blue ticks the low-pressure peaks from the toroidal well. b Third pair of V3 diamonds, X-ray wavelength λ = 0.406626 Å, the shaded diffraction peaks originate from Re on the culet, and blue labeled ones are from the torus, lower pressure

