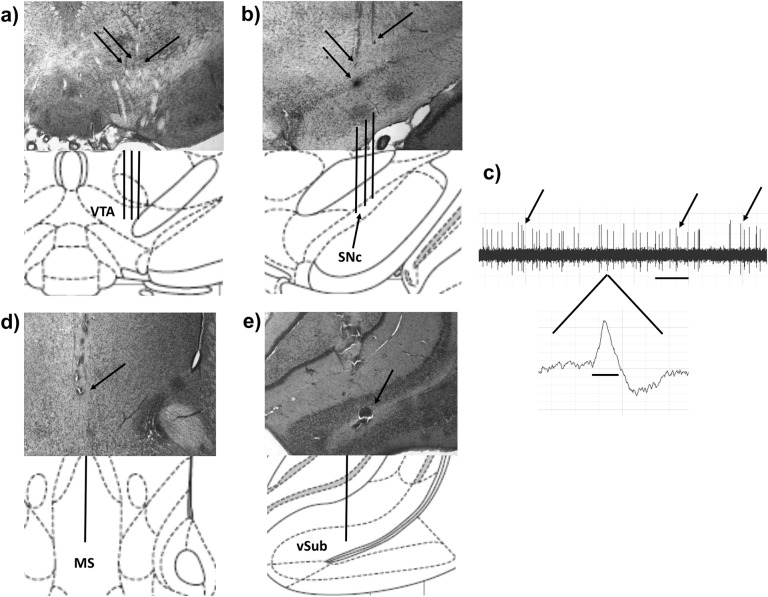
Fig. 1.
Representative placements, DA neuron identification, and drug infusion locations. a Population activity in the VTA was measured in nine sequential electrode tracks between AP −5.3 to 5.7 and ML 0.6–1.0. Arrows indicate three tracks across the medial–lateral span of the VTA. b Population activity is measured similarly in the SNc, between AP −4.9 to 5.3 and ML 2.0–2.4. Following the conclusion of the 9th track (top arrows), Chicago Sky Blue is ejected from the electrode leaving a blue dot for histological verification (bottom arrow). c Representative DA recording from the VTA and individual spike. The time bar for representative tracing equals 1 s, demonstrating a frequency of approximately six spikes per second. Arrows indicate three sets of spikes that are occurring in bursts. The time bar under the individual spike is 1.1 ms. Representative histology and matching illustration for the target region of the d MS and e vSub. The line in the illustration denotes the cannula placement and the arrow indicates the ventral termination of the cannula track

