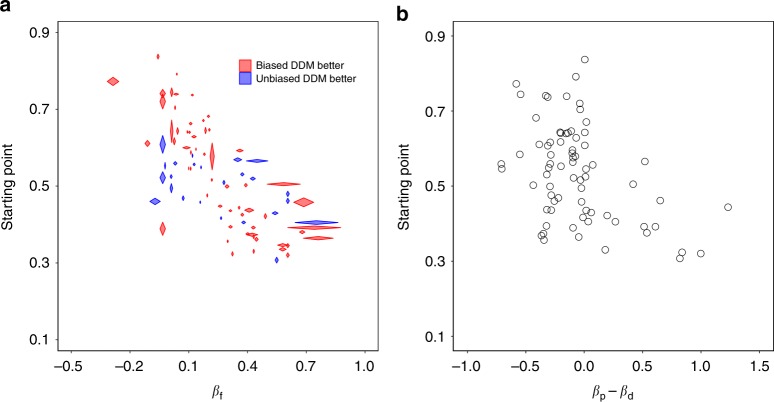
Fig. 6.
Starting point plotted against βf and βp−βd. a Starting point vs. βf, and b starting point vs. βp−βd. Each diamond in a and each circle in b represents one subject. The length of the horizontal diagonal of each diamond in a represents the standard error (SE) of the βf, and length of the vertical diagonal represents the standard error of the starting point. Red represents subjects who were better fit with the biased DDM, while blue represents subjects who were better fit with the unbiased DDM. For illustration purposes, we constrain −1 < βf < 1 and SE(βf) < 0.3 for a (82 of 102 subjects), and we constrain βp and βd to [−1, 2] for b (73 of 102 subjects), but we included all the 102 subjects in the statistical analysis

