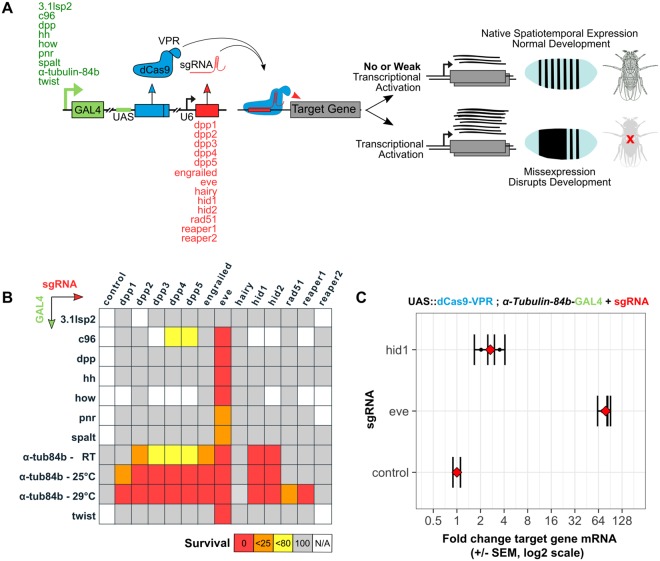
Figure 3.
Analysis of CRISPRa misexpression and induced lethality in the embryo. (A) Experimental scheme detailing the CRISPRa screen. GAL4 lines driving the expression of UAS::dCas9-VPR were crossed as females to sgRNA lines and levels of lethality recorded. (B) Synthetic lethality matrix indicating the effect of combinations of CRISPRa components. F1 progeny were screened for lethal levels of transcriptional activation inferred by the presence/absence of balancer phenotypes (Supplementary Data 1, 2 and 3, Supplementary Technical Cross 2 A-E). Percentage F1 survival is represented from crosses between female virgin GAL4/UAS::dCas9-VPR driver lines (vertical, alphabetical) to male sgRNAs lines (horizontal, alphabetical). Red, orange, yellow and grey cells indicate 0%, <25%, <80% and 100% survival, respectively. White cells represent crosses not performed and the control crosses contain no sgRNA. Lsp (larval serum protein), c96 (big bang), dpp (decapentaplegic), hh (hedgehog), how (held out wings), pnr (pannier). (C) qRT-PCR analysis of eve and hid expression levels in the embryo (Supplementary Technical Cross 3A). The control indicates eve expression using dCas9-VPR;αTubulin-84b-GAL4 in the absence of sgRNA. Two biological replicates were measured for each condition (black bars) and the mean is shown in red. Error bars show 95% confidence limits, calculated from three technical replicates.

