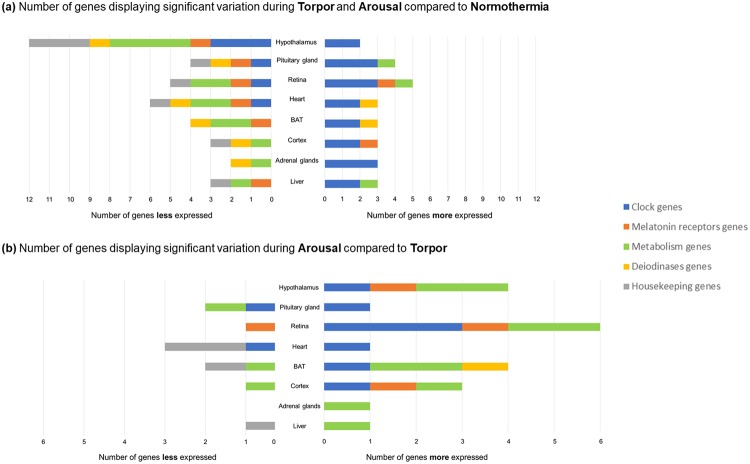
Figure 2.
Changes in the expression of functional families of genes in various tissues of the European hamster according to hibernation stage. Data represent the number of genes per functional family that were down-regulated (left side) or up-regulated (right side) in eight central or peripheral tissues. (a) Gene expression during torpor and arousal compared to gene expression during normothermia. (b) Gene expression during arousal compared to gene expression during torpor.

