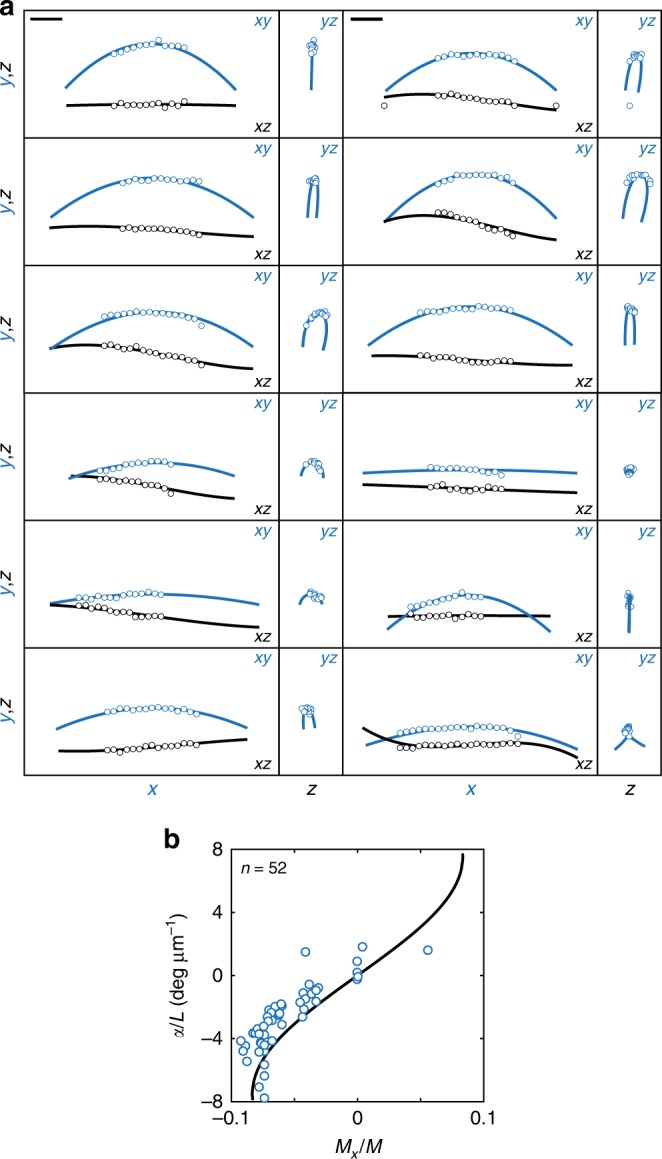
Fig. 4.

Comparison of theory and experiments. (a) Theoretical fits (curves) to the traces of microtubule bundles from horizontal spindles in live HeLa cells expressing PRC1-GFP (circles). Three different projections are shown: left, horizontal xy projection (blue), and xz projection (black); right, yz projection (blue). Parameters are, left column: M = (0,−5,180), (−5,−23,113), (−10,−68,117), (−8,−55,69), (−3,−26,27), (4,18,68) pNμm, right column: M = (−11,−43,159), (−20,−94,208), (−5,−31,108), (0,−2,8), (1,0,154), (−8,167,71) pNμm. Parameter L is taken from measurements. The other parameters are d = 1 μm and κ = 900 pNμm2. (b) Theoretical curve representing twist of a microtubule bundle, α, divided by spindle length, L, as a function of the twisting moment, Mx = Mix, normalized to the bending moment, (the same curve for i = 1,2). Circles represent experimental helicity of the traces of microtubule bundles from live HeLa cells expressing PRC1-GFP, as a function of the normalized twisting moment, obtained from fits. The parameters of theoretical curve are d = 1 μm, L = 12 μm and κ = 900 pN μm2. Scale bars, 2 μm
