. 2018 Aug 16;27(4):287–298. doi: 10.5607/en.2018.27.4.287

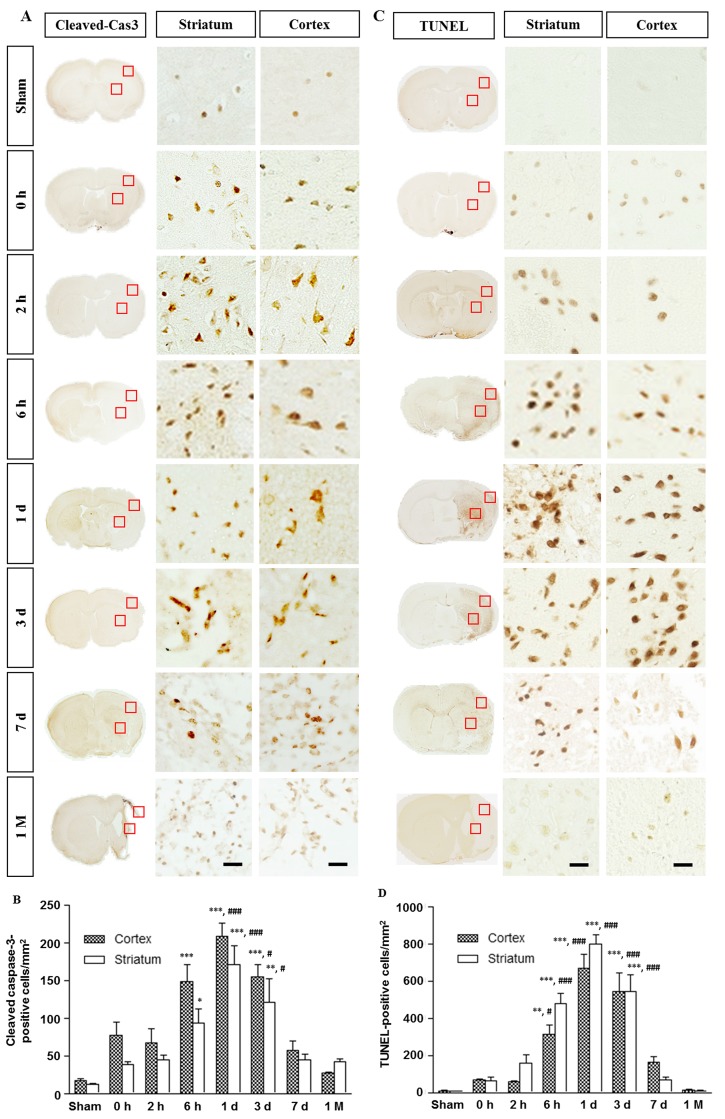
Fig. 4. Spatiotemporal profiles of the activated caspase-3 and TUNEL in the ischemic rat brain. (A) Immunostaining for activated caspase-3. Levels of caspase-3 activation in the core were significantly increased at 6 h and remained elevated 3 days after reperfusion. (B) Quantitative measurement of activated caspase-3 in the boxed area of 1 mm2. (C) The TUNEL-positive cells were not detected in the sham group but increased from 0 h reperfusion. The boxed areas in the full-size brain images are magnified to the representative image. (D) Quantitative measurement of TUNEL-positive cells in the boxed area of 1 mm2. Data are presented as means±SEM per mm2 obtained from four animals per group (*p<0.05, ***p<0.001, compared to the value of the sham group; #p<0.05, ###p<0.001, compared to the values of the 0 h time point). Scale bar, 20 µm.

Fig. 4