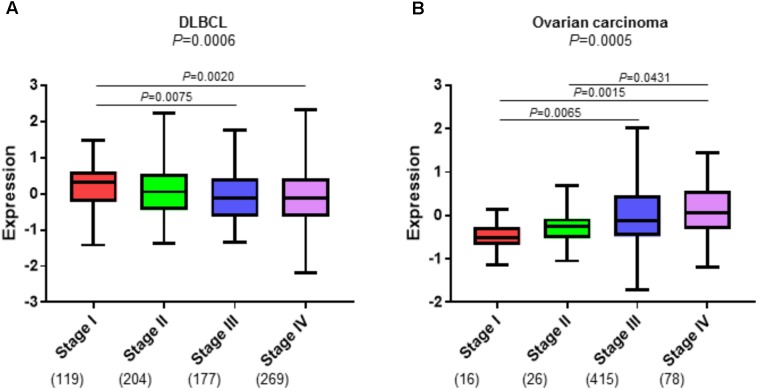
FIGURE 3.
CAFs have an inverse association with tumor stage in DLBCL and ovarian carcinoma. Enrichment of the DLBCL stromal-1 gene signature in progression stages I-IV in (A) three DLBCL microarray datasets (GSE10846, GSE87371, and GSE4475) that were combined into one dataset, and (B) The Cancer Genome Atlas (TCGA) ovarian carcinoma dataset (https://cancergenome.nih.gov). The gene signature enrichment analysis was performed using the R2 Genomics Analysis and Visualization Platform (https://hgserver1.amc.nl). The y axis shows relative enrichment of the DLBCL stomal-1 gene signature. The x axis shows tumor stage. The number of samples for each tumor stage is indicated in parentheses.

