
FIGURE 5.
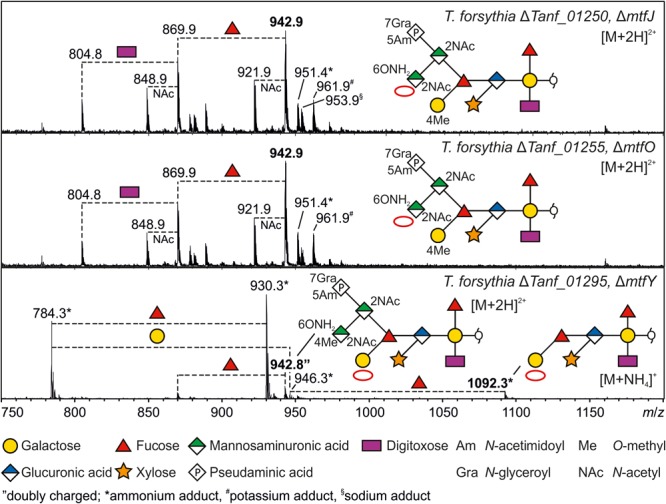
ESI-MS sum spectra of β-eliminated TfsB O-glycans from T. forsythia ATCC 43037 methyltransferase knock-out mutants. The glycan structures of the signals corresponding to the largest mass (bold m/z values) are shown in SNFG representation (Varki et al., 2015). Other O-glycan signals detected for the respective mutants were assigned based on the m/z mass differences corresponding to the loss of individual sugar units and/or modifications. The lack of methyl modifications is indicated by a red circle in the symbolic O-glycan structure representation.