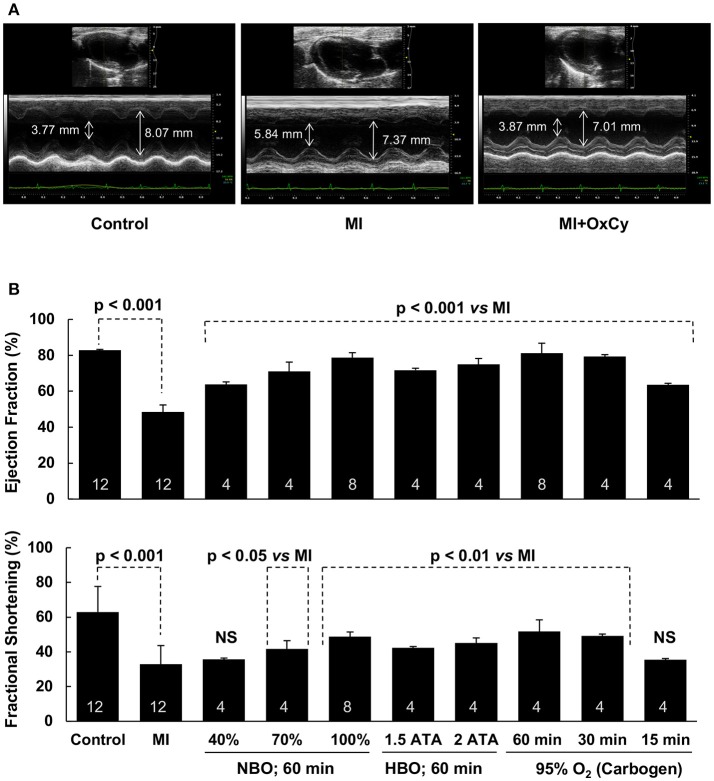
Figure 3.
Recovery of cardiac function of MI hearts following OxCy. Cardiac function was measured using transthoracic M-mode echocardiography. (A) Representative echocardiogram of Control, MI, amd MI hearts treated with OxCy using 95% oxygen (carbogen) for 60 min/day for 5 days. Systolic and diastolic diameters are shown on the images. (B) Left ventricular ejection fraction and fractional shortening are shown for non-MI hearts (Control), untreated MI hearts (MI), MI hearts reated with OxCy for 1 h/day with 40% O2 (40%), 70% O2 (70%), 100% O2 (100%), 100% O2 at 1.5 ATA (1.5 ATA), 100% O2 at 2 ATA (2 ATA), 95% O2/5% CO2 (60 min), 30 min/day with 95% O2/5% CO2 (30 min), and 15 min/day with 95% O2/5% CO2 (15 min). Data represent Mean ± SD. Number of hearts per group is shown on the bar. Statistical significance, as indicated; NS indicates not significant when compared to MI group.

