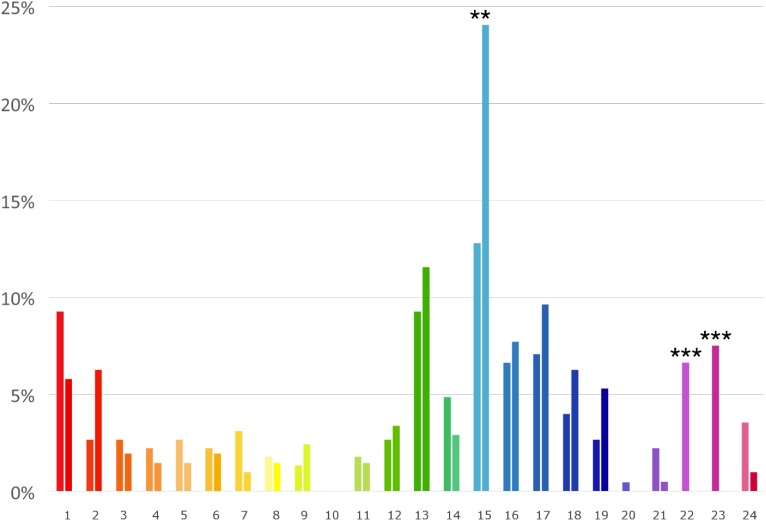
FIGURE 6.
General chromatic preference (%) in females (left bar) and males (right bar) for the 24 hues shown in Figure 4. Lightness level of each bar matches the mean preferred lightness level (radial axis in Figure 4). Asterisks show the significance level for the male-female comparison (∗∗p < 0.01, ∗∗∗p < 0.001).

