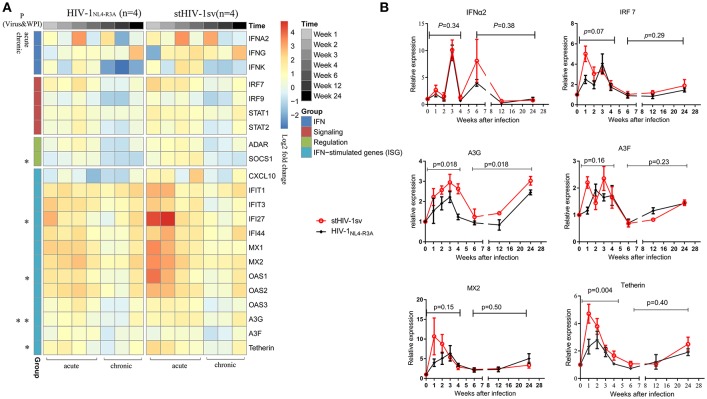
Figure 5.
The expression of IFN-related genes during primary infection of HIV-1NL4−R3A and stHIV-1sv. (A) The hotmap of IFN-related genes expression. 22 genes were significantly induced by HIV-1NL4−R3A and stHIV-1sv infection (wpi = 1, 2, 3, 4, 6, 12, and 24) and differentially expressed in the HIV-1NL4−R3A (n = 4) and stHIV-1sv (n = 4) infected macaques. Clusters were performed on the average of log2 ratios of mRNA expression relative to the basal levels before infection by the RT-PCR-based ΔΔCt method. The progressive decreases or increases in mean log2-fold-change were represented by the changes of blue to red colors. (B) The dynamic expression of some selected genes involved in IFNα2, IRF7, and restriction factors MX2, Tetherin, APOBEC3G and APOBEC3F. P-value differences between HIV-1NL4−R3A and stHIV-1sv infected groups were calculated by two-way analysis of variance.

