Figure 11.
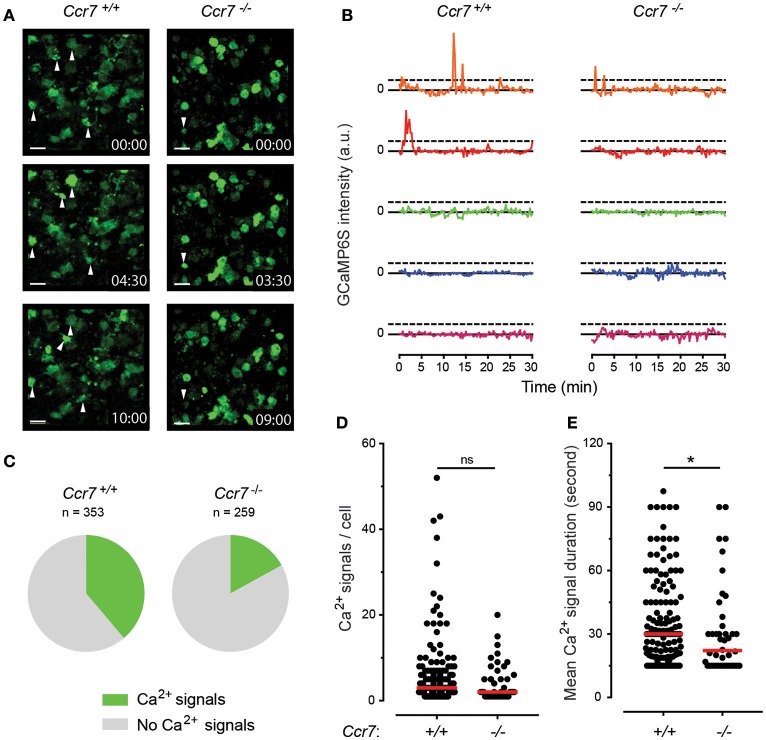
CCR7-induced Ca2+ signaling during entry of Cas9-Hoxb8-DCs transduced with Ca2+ sensor GCaMP6S into the lymph node. (A) Ex vivo time-lapse imaging of lymph nodes within 5 min after intralymphatic injection of 4 × 10⁴ Ccr7+/+ Hoxb8-DCs (left) or Ccr7−/− Hoxb8-DCs (right) transduced with Ca2+ sensor GCaMP6S. White arrowheads indicate cells with changes in GCaMP6S signal intensity, indicating changes in Ca2+ concentration within the cell. For more details see Supplementary Video 1. Scale bar represents 15 μm. (B) Changes in GCaMP6S signal intensity for each 5 GCaMP6S+ Ccr7+/+ Cas9-Hoxb8-DCs and GCaMP6S+ Ccr7−/− Cas9-Hoxb8-DCs. Data are represented as a difference in GCaMP6S signal intensity for each time point to the median value for next 3 min. Horizontal dashed lines depict thresholds [defined as a change in a signal intensity >1,000 arbitrary units (a.u.)] used to detect Ca2+ signals. (C) Pie-charts indicating the percentage of GCaMP6S+ Ccr7+/+ Cas9-Hoxb8-DCs or GCaMP6S+ Ccr7−/− Cas9-Hoxb8-DCs with changes in Ca2+ signals. There is a significant difference between groups (p < 0.001, two-tailed Fisher's exact test). (D) Number and (E) average duration of Ca2+ signals (changes in GCaMP6S intensity) per cell for the tracks with at least one recorded Ca2+ signal. In (D,E) dots represent individual cells and red line median group value. Asterisk (*) indicates significant difference (p < 0.05), while ns indicates no significant difference (Mann–Whitney test). Data are representative (A,B) or pool (C–E) of 6 independent experiments with total of 7 lymph nodes per cell type.

