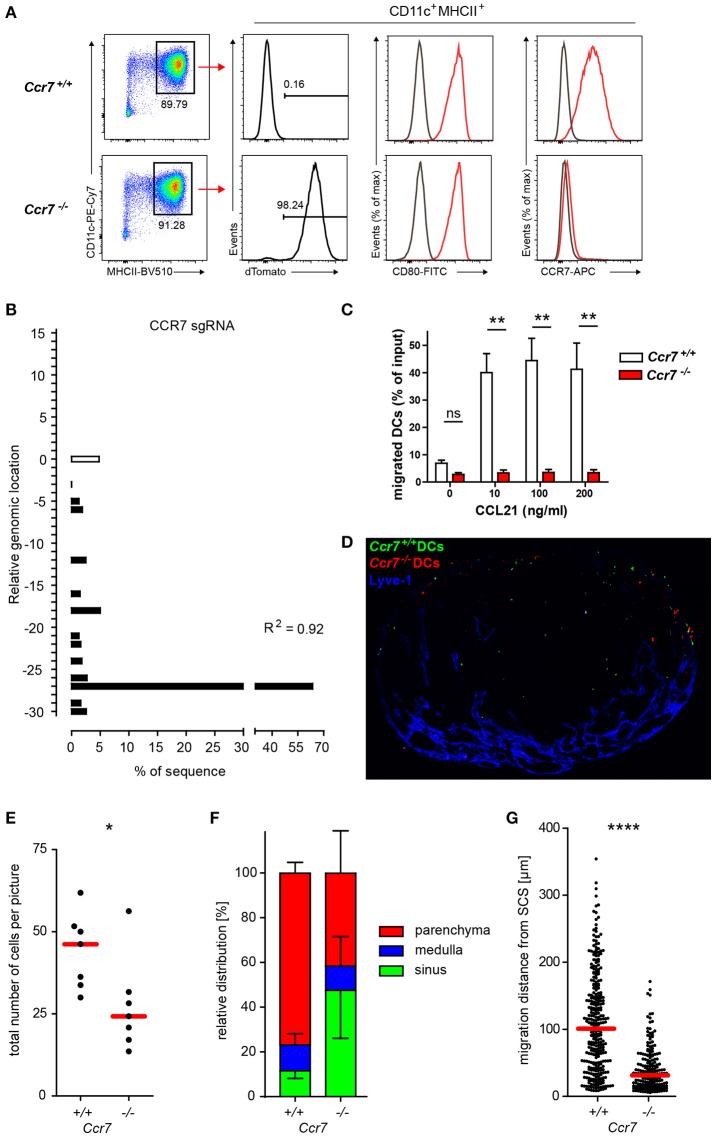
Figure 7.
Phenotypic and functional verification of CRISPR/Cas9-mediated knockout of Ccr7 in Hoxb8 cell-derived DCs. (A) Cas9-Hoxb8 cells were transduced with a dTom- and CCR7gRNA-encoding lentivirus. Successfully transduced cells were sorted based on the expression of dTom and subsequently differentiated to mature DCs in the presence of GM-CSF followed by treatment with LPS. Ccr7+/+ and Ccr7−/− DCs were analyzed by flow cytometry for their expression of CD80 and CCR7. Data are representative for four independent experiments. (B) Analysis of the composition and frequency of insertions and deletions of Ccr7−/− Cas9-Hoxb8 cells. R, Pearson correlation coefficient; R2 describes how strongly the calculated chromatograph of the indel distribution correlates with the Sanger sequencing results of the sample DNA. (C) Chemotactic migration of Ccr7+/+ and Ccr7−/− DCs for 2 h toward medium alone or 10, 100, and 200 ng/ml CCL21. Data are pooled from 3 independent experiments with n = 8 in total. Mean + SEM; Kruskal–Wallis and Dunn's multiple comparisons test; ns, not significant; **p < 0.01. (D) Microscopy of popliteal lymph nodes obtained 4 h after intralymphatic injection of YFP-expressing Ccr7+/+ DCs and dTom-expressing Ccr7−/− DCs (5–8 × 10⁴ cells in 5 μl PBS; scale bar: 200 μm). (E) Total cell counts and (F) relative distribution of Ccr7+/+ and Ccr7−/− DCs 4 h after intralymphatic injection into popliteal LNs of B6 mice. (G) Migration distance from the subcapsular sinus (SCS) for the Ccr7+/+ and Ccr7−/− DCs that entered LN parenchyma. Dots represent cell number per LN section (E) or individual cells (G). Data are representative for (D) or pooled from (E–G) two independent experiments with a total of 7 lymph nodes analyzed. Error bars, SD; red bars, median; Mann–Whitney test; *p < 0.05; ****p < 0.0001.

