
FIGURE 6.
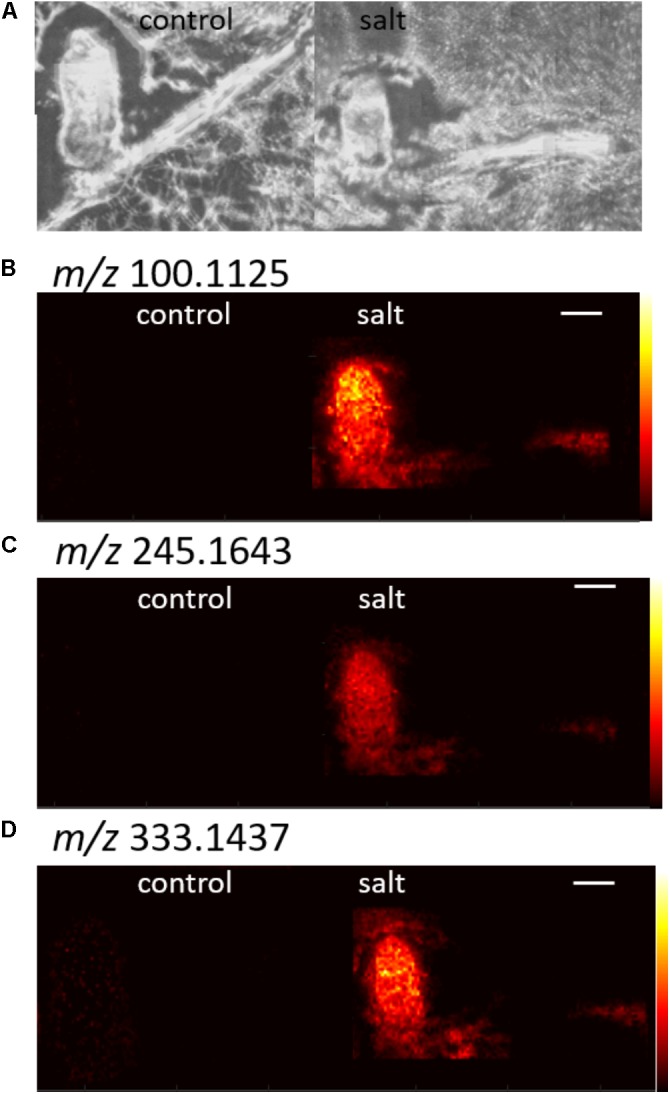
Example images for selected m/z ions in salt treated nodules with AUC values above 0.75. The optical image is shown in (A) and (B–D) show three different m/z. CHCA was the matrix for all images shown. The white scale bar indicates 1 mm.
Official websites use .gov
A
.gov website belongs to an official
government organization in the United States.
Secure .gov websites use HTTPS
A lock (
) or https:// means you've safely
connected to the .gov website. Share sensitive
information only on official, secure websites.
Example images for selected m/z ions in salt treated nodules with AUC values above 0.75. The optical image is shown in (A) and (B–D) show three different m/z. CHCA was the matrix for all images shown. The white scale bar indicates 1 mm.