Figure 5.
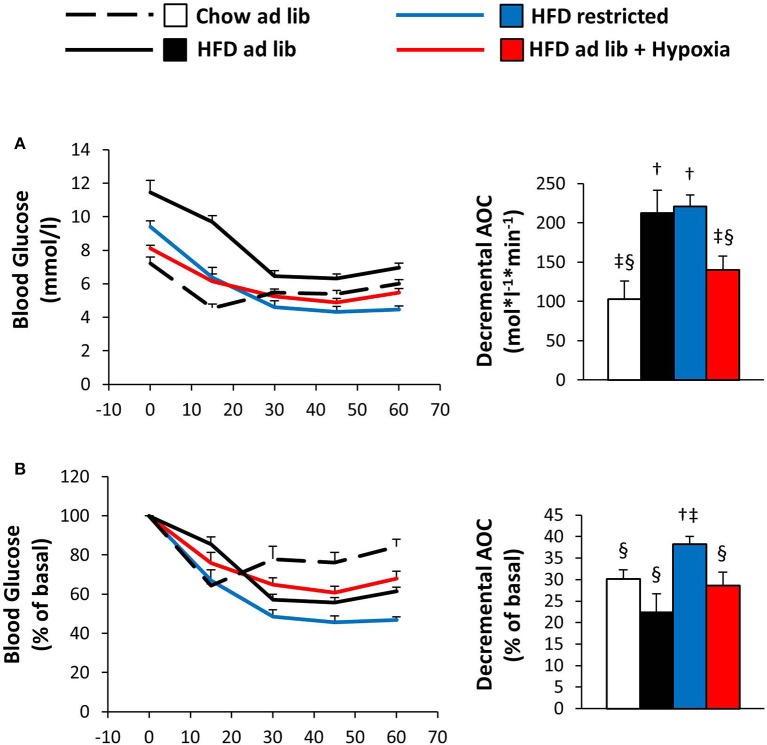
Blood glucose curves during the insulin tolerance test given as absolute concentrations (A) or as relative (%) changes vs. the starting value (B) in four groups of mice after 3 months under different conditions: free access to chow diet (Chow ad lib; n = 8); free access to high fat diet (HFD ad lib; n = 8); free access to HFD under hypoxia (HDF ad lib + Hypoxia; n = 12); restricted access to HFD, weight-matched with the hypoxia-exposed group (HFD restricted; n = 12). Means ± SEM; AOC, area over the glucose curve; p < 0.05 by Student's t-test: bar graphs, †vs. Chow ad lib, ‡vs. HFD ad lib, §vs. HFD restricted.

