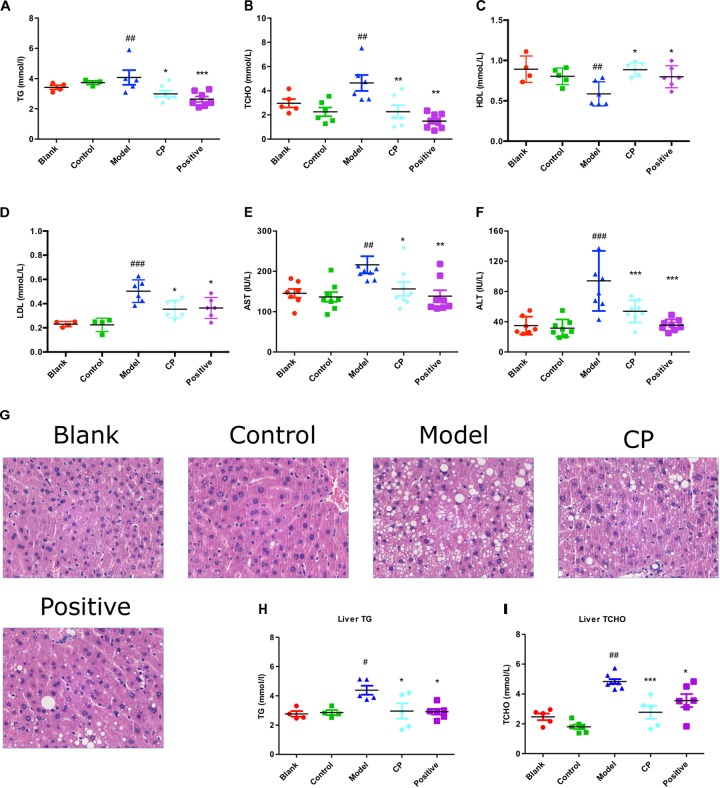
FIGURE 1.
Cyclocarya paliurus attenuated diabetic dyslipidemia and hepatic steatosis induced by high fat diet and STZ in mice. Blank: non-diabetic control group; Control: CP-treated non-diabetic control group; Model: STZ and high fat diet-induced diabetic model group; CP: CP treated model group; Positive: glibenclamide treated model group. (A–F) Serum TG, TCHO, HDL, LDL, AST, and ALT level. (G) Histology analysis of liver tissues by H,E staining. (H,I) Liver TG and TCHO level. All data are presented as means + SEM (n = 6∼8). #p < 0.05, ##p < 0.01, ###p < 0.001 (comparison between control and model group); ∗p < 0.05, ∗∗p < 0.01, ∗∗∗p < 0.001 (comparison between CP group, positive group, and model group).

