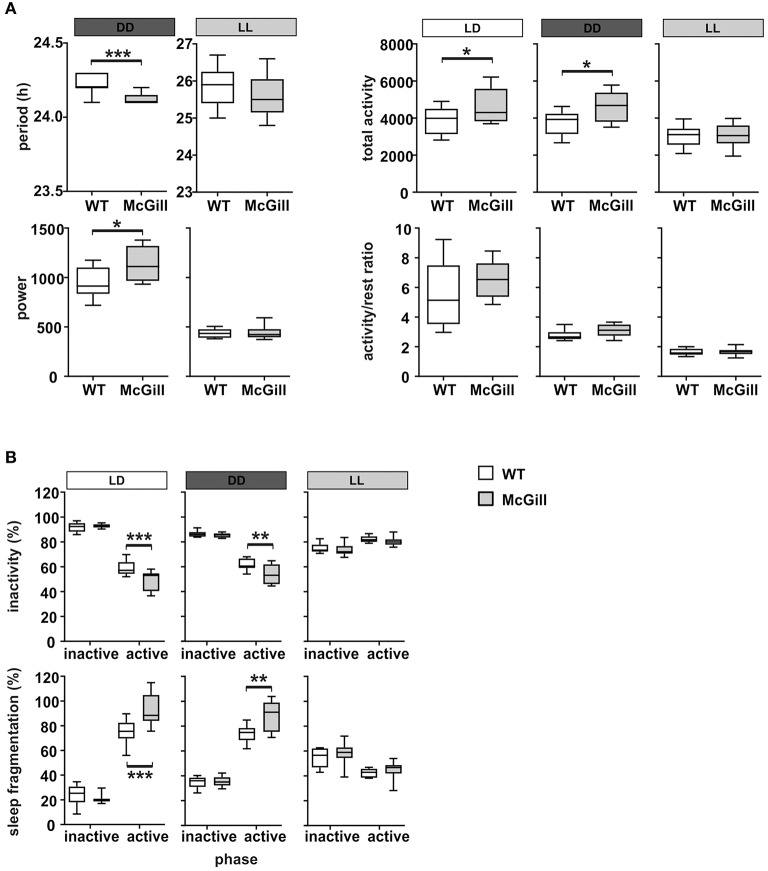
Figure 13.
Analysis of locomotor activity parameters. (A) Period, estimation of the power of period, total activity and the activity/rest ratio of WT (empty boxes) and McGill (gray boxes) rats analyzed in LD (white bar above the plot), DD (dark gray bar), or LL (gray bar), respectively. (B) Inactivity (percentage of time spent resting) and the sleep fragmentation index (percentage of restlessness during inactivity) of WT and McGill rats analyzed separately for inactive (i.e., daytime on LD) and active (i.e., nighttime on LD) periods during LD, DD, and LL regimes. The data are expressed as median with 25 to 75th percentile box and min to max value whiskers, n = 9–10/group. The results of the statistical comparisons between groups are depicted. *p < 0.05; **p < 0.01; ***p < 0.001.

