Figure 14.
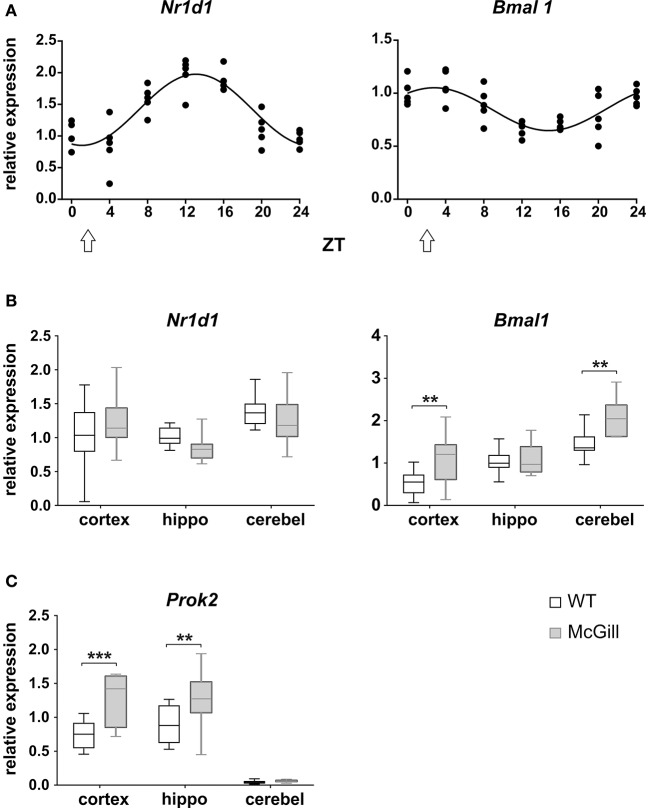
Analysis of mRNA levels. (A) Circadian profile of Nr1d1 and Bmal1 gene expression in the cerebellum of WT rats. The rats were sacrificed in 4-h intervals during 24 h. Time is expressed as Zeitgeber time (ZT); ZT0 represents the time of lights on in the previous LD12:12 cycle. The data are fitted with a cosinor curve; n = 4–5/time point. (B,C) Relative expression of Nr1d1 and Bmal1 (B) and Prok2 (C) in the cortex, hippocampus (hippo) and cerebellum (cerebel) of experimental control WT (white) and McGill (gray) rats. The animals were sacrificed at ZT3 (as depicted by the white arrow in A). The data are expressed as median with 25 to 75th percentile box and min to max value whiskers, n = 9–10/group. The results of the statistical comparisons between groups are depicted. **p < 0.01; ***p < 0.001.

