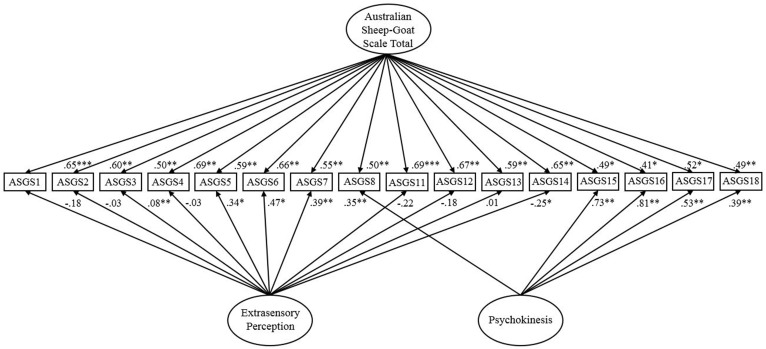
FIGURE 1.
Two-factor bifactor model of the Australian Sheep-Goat Scale. Latent variables are represented by ellipses; measured variables are represented by rectangles; error is not shown but was specified for all variables. ∗p < 0.05; ∗∗p < 0.01; ∗∗∗p < 0.001 (using bootstrap significance estimates).

