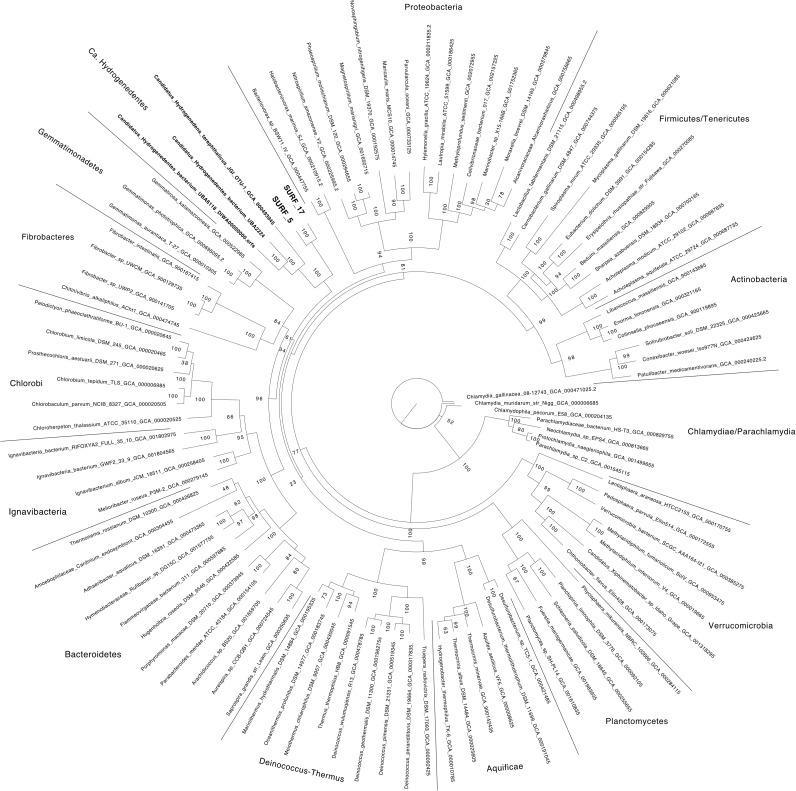
FIGURE 1.
Bacterial phylogeny estimated from the maximum likelihood phylogeny of 16 concatenated ribosomal proteins is shown. SURF_5 and SURF_17 collected from SURF fluids are indicated with bold-face font. Scale bar indicates 0.2 amino acid substitutions. Support values are reported from 1000 replicates, with a value of ‘100’ shortened to ‘1’ for brevity. The list of proteins used to build the tree can be found in Supplementary Data File 1.

