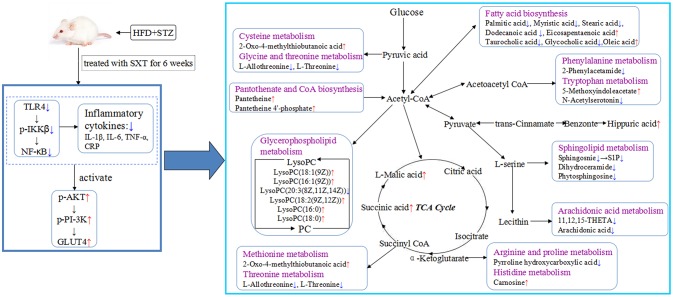
Figure 11.
Systemic view of metabolic pathways associated with SXT treatment in T2DM rats. (Compared with the model group, the red arrows represented the increase of the contents of endogenous metabolites, while the blue arrows represented the decrease of the contents of endogenous metabolites. Purple colors indicated the names of the related metabolic pathways).

